
Key Takeaways
We believe the current market enthusiasm for tech and AI companies with extreme valuations (e.g., 20x price to sales) reflects an unsustainable ecosystem reminiscent of past speculative bubbles
Financial engineering within the AI ecosystem, including vendor financing and speculative spending, raises sustainability concerns due to limited evidence of meaningful returns and high infrastructure costs
While AI holds transformative potential, we advocate for a cautious, data-driven investment approach, emphasizing sustainable growth areas like US regulated utilities, Indian infrastructure, Brazilian banks, and European pharma
Historical Comparisons: TODAY’S MARKET AND PRIOR MANIAS
No doubt, the tale of the tape post-“Liberation Day” in 2025 has been all about tech and tech-like companies reaching new highs, particularly for stocks with a tangential tie to AI. The third quarter was much of the same across both developed and emerging markets, but with the announced forecasts getting less and less believable and the ecosystem, in our view, becoming increasingly fragile.
As we have noted multiple times in our last white papers highlighting the similarities of today’s tech to the Nifty Fifty and explaining why we believe the current environment is even worse than the dotcom mania, our views are not driven by dogma, but rather, probability.
US Becoming a Single Theme Index
Bull markets go to people’s heads. If you’re a duck on a pond, and it’s rising due to a downpour, you start going up in the world. But you think it’s you, not the pond.”
– Charlie Munger
For folks who have been invested with us for a while, you are likely aware of two of our key principles: 1) we eat our own cooking as we are meaningfully invested alongside our clients and 2) we are happy to own companies in any industry, including the tech and tech-plus space when we believe the fundamentals are commensurate with the prices being paid. Historically, we have owned tech, and often in a significant way. We believe we sit at a very different vantage point compared to, say, an investment manager who avoids specific sectors or industries—either because they are too expensive (for value managers) or because they fail to meet a high hurdle rate for revenue or earnings per share (EPS) growth (for growth managers).
Our view is simply that current prices in most tech companies are not commensurate with the growth that we believe can actually be captured by investors on a prospective basis.
Not only that—and at the risk of sounding like Grandpa Simpson yelling at clouds—our current underweight to this global thematic driving the world is, in our view, a prudent positioning in a market that seems to only focus on upside potential and completely ignore the possibility of any downside.
No One Is an Atheist at 20x Price to Sales
The Mirage of 20x Price to Sales: Unveiling Market Fragility
In our most recent piece, “Dotcom on Steroids,” we highlighted the number of stocks in the S&P 500 trading at more than 10x sales, which was more than 30% of the index as of the end of August.
Now let us take it to the extreme; roughly 13% of the S&P 500 (by index weight) trades at more than 20x price to sales as of the end of September. Not earnings, but sales. Nvidia for example was 28x P/S at this date.
This exceeds the level from the peak of the dotcom bubble in 2000, which was roughly 11% of the index. It is worth reminding readers that this is not a small-cap or micro-cap index, these are many of the largest companies by market cap on earth. To us, this is far worse than a simple buy-and-hold strategy. We believe this is clearly a buy-and-hope.
Tech Valuations—A Risky Proposition
And herein lies the rub. When we think about the sustainability and durability of earnings growth, it becomes very difficult to find that in an area where many valuations are sky-high, and industries are seeing both competitive pressures and increased commoditization of their products. When was the last time consumers paid a premium for a commodity? They typically do not.
For example, the number of Chinese AI companies has exploded from 1,454 in 2020 to over 5,000 as of early September—equivalent to roughly one new AI company launching every 11 hours.1
Pie in the Sky
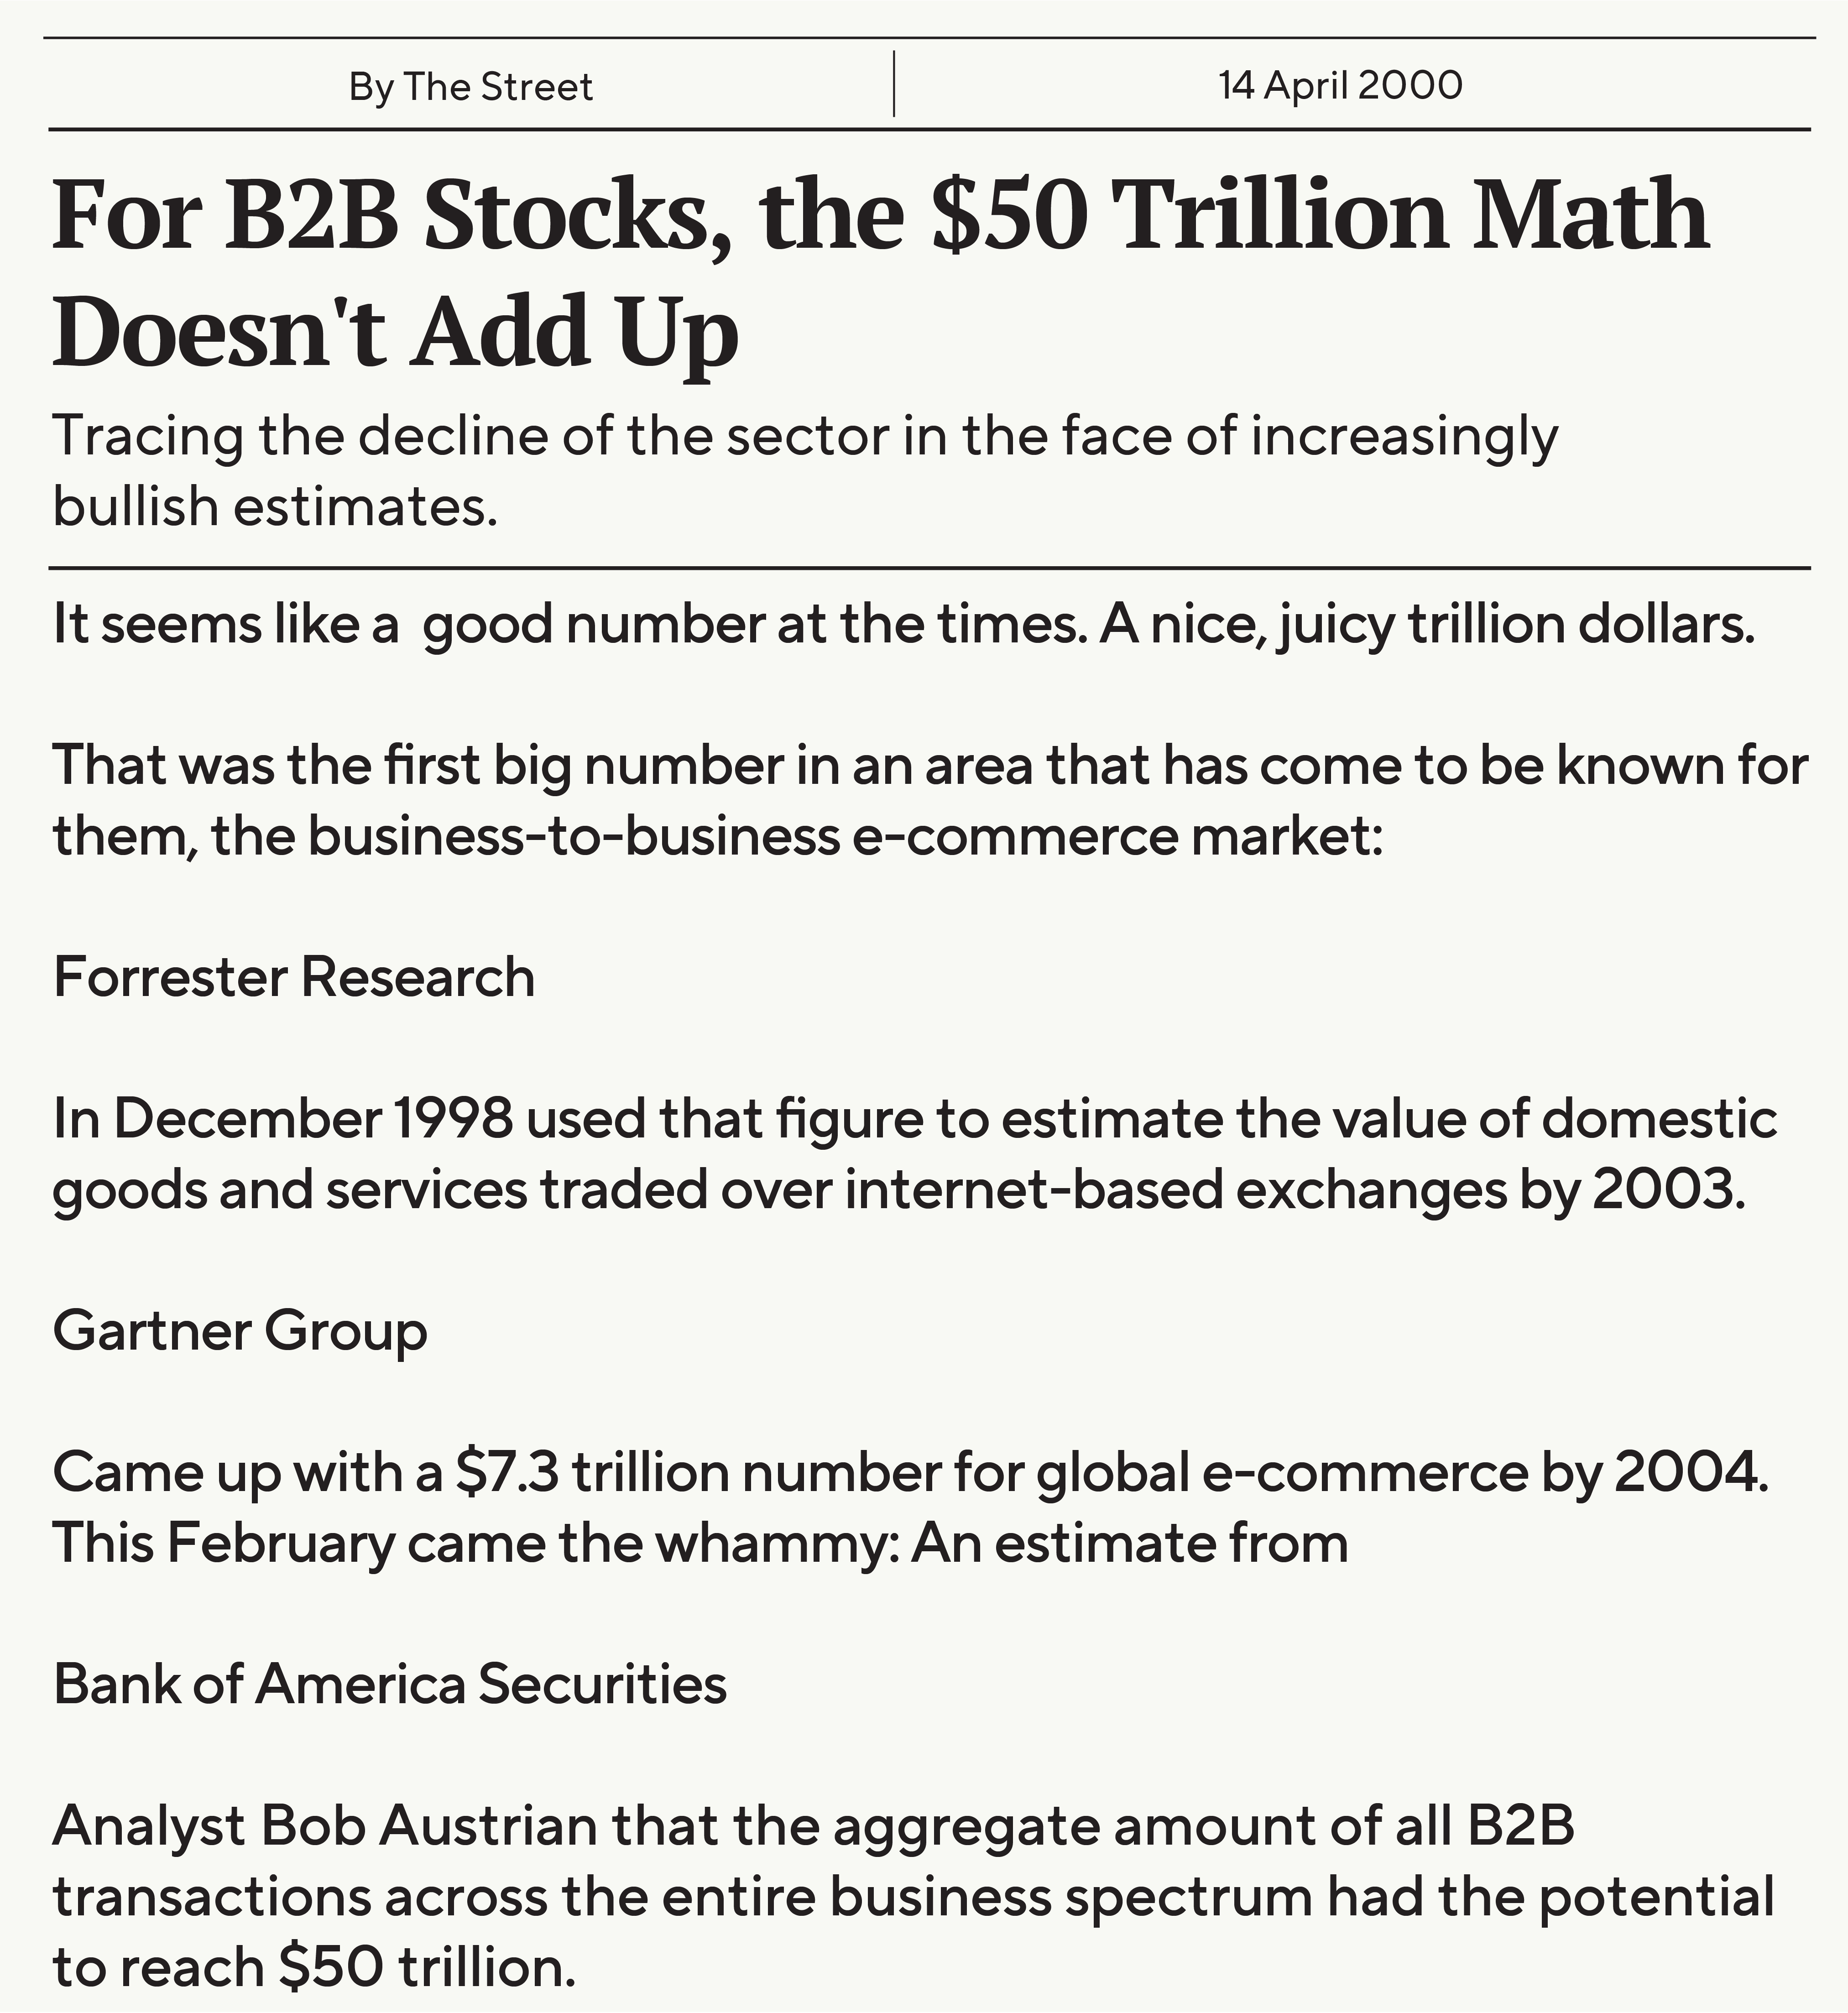
Source: GQG Partners LLC. The Street.com (data). Bousquin, Joe. “For B2B Stocks, the $50 Trillion Math Doesn’t Add Up” TheStreet. 14 April 2000.
This hardly seems sustainable, nor meaningfully profitable, especially when considering that in enterprise settings, an estimated 95% of AI-related projects have basically done nothing, according to MIT.2 Even in the once-lucrative cloud space, where Amazon still maintains the highest market share, Oracle’s entrance and massive price-cutting campaign is already taking a bite out of both margins and market share of the incumbent players.
In our view, simply increasing spending does not necessarily increase the likelihood of any of this generating meaningful returns. OpenAI recently shared their ambitions to hit US$1 trillion in infrastructure spend,3 but plenty of fanciful numbers were floated out during the dotcom mania too. For example, one Bank of America analyst forecasted that total B2B e-commerce would reach US$50 trillion by the early 2000s. That’s trillion with a t. Yet total US nominal GDP in 2025 is just south of US$30 trillion. Let that sink in.
The Short-Lived Assets of AI
Beyond this, remember that the CapEx being spent (or announced) today is categorically different than the CapEx spent on canals and railways, and from fiber optic cables to cell towers in the past. Those assets were far longer lived than the GPUs in AI datacenters today, which, by Jensen’s own admission, only last one to two years. Whether the chips themselves physically last beyond two years or not, their value, as shown by GPU rental indexes, are falling off a cliff.
Renting Ain’t Easy
Major infrastructure of the past did not need to be replaced as frequently as GPUs today. Not only that, but in these prior spending sprees, many of the early companies were highly profitable. Take for example, canals, as highlighted in Edward Chancellor’s “Devil Take the Hindmost”:
The canal age in Britain commenced with the completion in 1767, of the Duke of Bridgewater’s canal, which ran some thirty miles from the coal mines on the Duke’s estate at Worsley, northwest of Manchester, to Runcorn in the southwest, where the new textile factories were situated. Over the following two decades more than a thousand miles of canals were constructed. The first canals produced tremendous returns on capital, paid large dividends and enjoyed soaring share prices.
So, these early profitable projects were quite a radical departure from what we are seeing today, where most projects are highly unprofitable despite billions and billions of dollars being spent. For canals, it took decades of oversupply before returns ultimately came back to earth:
By the turn of the (19th) century, the overall return on capital invested in canals had fallen from a pre-mania level of 50% to around 5%. Even a quarter of a century later, one in five canals was unable to pay a dividend and aggregate dividends as a percentage of capital invested produced a return similar to those of risk free bonds.4
This historical example is a far cry from where we are in 2025, where there is an extraordinary amount of money, on a global basis, being thrown around, in a very circular fashion, simply chasing a hypothesis of achieving artificial general intelligence—and one that appears to already be hitting a wall. As AI researcher Gary Marcus highlighted in August 2025 on the back of Chat GPT-5’s disappointing release:
Science is not a popularity contest; you can’t bully your way to truth. And you can’t make AI better if you drown out the critics and keep pouring good money after bad. Science simply cannot advance without people sticking to the truth even in the face of opposition.
The good news here is that science is self-correcting; new approaches will rise again from the ashes. And AGI—hopefully safe, trustworthy AGI–will eventually come. Maybe in the next decade.
But between the disappointments of GPT-5 and a new study from METR that shows that LLMs do markedly better on coding benchmarks than in real-word practice, I think it is safe to say that LLMs won’t lead the way. And at last that fact is starting to become widely understood.5
This may be well understood by some but it is clearly not understood by global market participants who are taking OpenAI at their word on promises of US$200 billion in revenue and turning profitable by 2030, in our view. These estimates are despite the fact that OpenAI has only a 2% conversion rate of paying customers—yes, 98% of “customers” find ChatGPT so useful they do not even pay for it—and query results can cost a dollar per search, or more, for deep reasoning answers that take longer than 60 seconds. For the measly 2% of customers who actually pay for ChatGPT, that is just 20 “deep reasoning” searches per month per premium user before OpenAI starts losing money.
Show Me the Money
Given the sheer volume of dollars in the global AI CapEx buildout—hundreds of billions out of US hyperscalers versus tens of billions out of those in China—this phenomenon is pervasive on a global basis. For example, in early October, both Samsung and SK Hynix added a combined US$37 billion to their respective market caps simply by issuing a letter of intent to supply OpenAI with up to 900,000 wafers in 2029.
No firm commitments, no exchanges of cash, just a letter of intent.6 This no doubt drove sentiment across Korea, but has also bled into areas such as China, with the likes of Alibaba seeing strong overall cloud growth, albeit against severe pricing pressure as the Chinese Ministry of Industry and Information Technology (MIIT) scrambles to encourage companies to use the 70%-80% of spare aggregate capacity in their datacenters today. If this reminds you of China’s past bridge to nowhere infrastructure boom/bust cycle, just think of how much more spending we have seen from US hyperscalers. Tangential areas, such as industrials across Europe, have also benefited by simply being “perceived” as AI beneficiaries.
Perceived AI Beneficiaries in Europe Have Done Well
Creative Financing and the AI Bubble
In our view, the entire global footing of this One Big AI Dream rests almost entirely on two principles: 1) creative financing, combined with 2) the Field of Dreams mantra of “if you build it, they will come.” But of course, we have seen this movie before. Unlike canals, we do not need to go back to the 18th century when we can go back just 25 years to the dotcom bubble to see a similar phenomenon at work. From a recent Washington Post article:
Part of what blew the bubble ever larger was layers of financial engineering. Qwest and Global Crossing CLECs started to engage in “dark fiber swaps,” which deserve their slightly sinister name. Carriers would sell each other fiber they weren’t using yet, with each booking the capacity they had “sold” as revenue, while accounting for the cost of the capacity they’d bought capacity as an asset on their balance sheet, not as a hit to income. In other words, revenue magically appeared, while costs were buried. The former director of European Access Management for Global Crossing, who worked on these deals back in the day, tells me that originally, the agreements had a business purpose: letting a carrier quickly expand into new routes without digging. “That quickly changed when sales/marketing and ultimately the [senior] leadership saw how these deals could massively goose the numbers and close “revenue” gaps,” he wrote to me. (His current employer won’t allow him to use his name in the press.)7
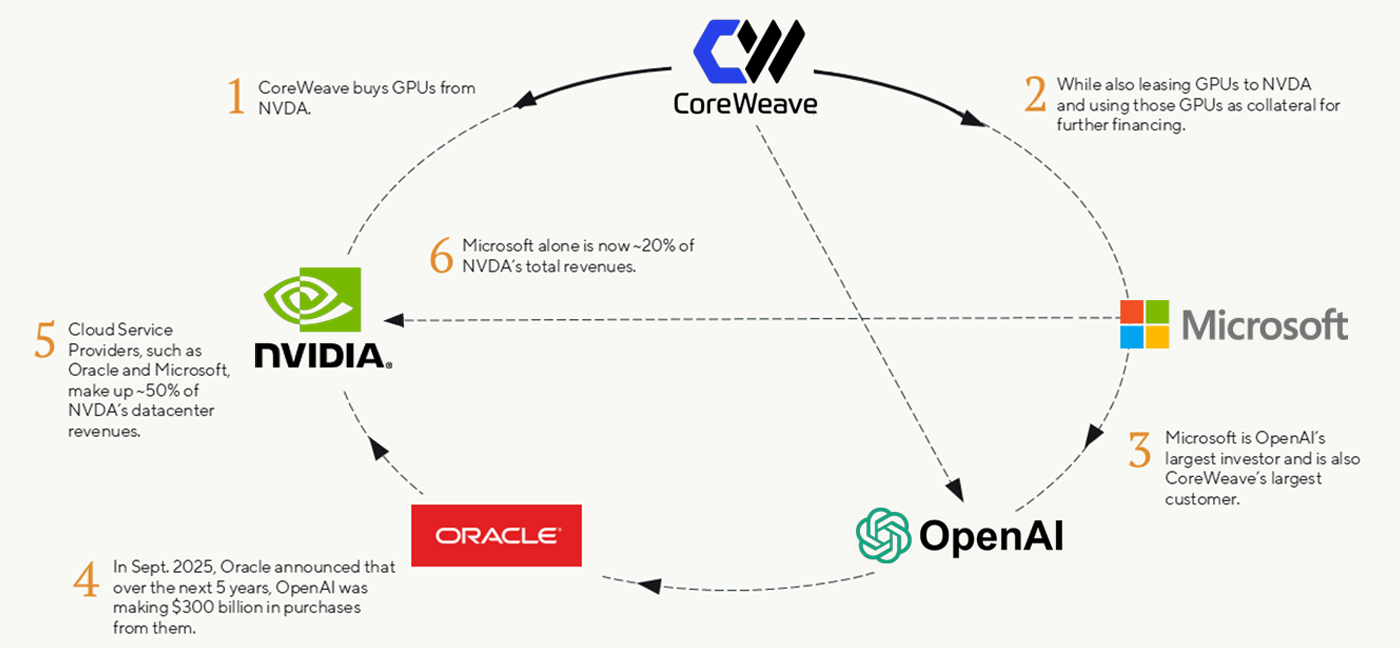
All this sounds eerily familiar, especially with the recent news that Nvidia is considering leasing chips to its customers,8 or the recent US$300 billion deal between OpenAI and Oracle for computers that do not exist in exchange for money that OpenAI does not have.9
The whirlpool of financing does not end there. Nvidia participated in 52 different venture deals with AI companies in 2024 with another 50 deals so far this year.9 To add perspective, Lucent had vendor financing commitments equal to 24% of their 1999-2000 revenues, while Nvidia’s direct investments equal two-thirds of their annual revenue.10
Money for Nothin’ and AI Revenues for Free
Source: GQG Partners LLC (illustration). Company financials (data). Content does not constitute investment advice, and no investment decision should be made based on it.
Beyond the creative financing, we are seeing the “if you (try) and build it, they will come… to protest!” with a recent Alphabet data center plan getting pulled in Indianapolis due to protests.11 And what is really driving the folks to protest, beyond the “not in my backyard” movement, we believe is the soaring price of electricity.
For all of the talk about future prices, we do not need to speculate on what might happen, we can already see what is happening today before many of these future datacenters come online. The electricity component of CPI has been outpacing overall CPI for the last 10 years and has really accelerated over the last five. No wonder people are frustrated.
Let us not forget that something can be simultaneously revolutionary yet also destroy insane amounts of capital. That is what bubbles tend to do. Railways, the internet, and now generative AI can make incredible amounts of progress and permeate everything we do. But paying too high a price today for a highly uncertain tomorrow has historically been a bad tradeoff.
Electricity Prices—High and Rising
| Annualized | ||
| CPI-Electricity | CPI-All | |
| Last 10 years | 3.53% | 3.13% |
| Last 5 years | 6.49% | 4.46% |
Source: GQG Partners LLC (chart). FRED (data). Annualized percentage increases for periods ending 30 September 2025.
We are well aware of Wimpy’s quip that he will “gladly pay you tomorrow for a hamburger today.” In fact, this has been a growing business model over the last several years, as evidenced by the increase in “buy now, pay later” companies (see Klarna IPO). But the fact that a meme basically becomes reality does not mean that it stays a reality. How global equity markets unfolded in 2022 should be pretty good evidence of that.
Overlooked Opportunities–Real Growth Beyond the AI Hype?
Again, for the focus on what may possibly happen in the future, it is curious to us why investors have generally avoided positive events that are underway as we write. For example, in India, the Navi Mumbai airport will commence in early October. It is set to handle around 20 million passengers domestically and globally, while ultimately scaling up to around 90 million, placing it as one of the busiest airports in the world.
Or take Adani Ports, which just recorded its highest ever cargo and rail volumes in the first half of its fiscal year 2026.12 We are also seeing a large digital banking revolution underway in Brazil, where overall digital payments have surpassed 80%, up from just over 50% about a decade ago.13 In European pharma, we believe a reduction in the uncertainty around drug pricing combined with positive news on the breast cancer front may finally see that space turn a corner as well.
New Tech, Booming Productivity & Bursting Stock Bubbles
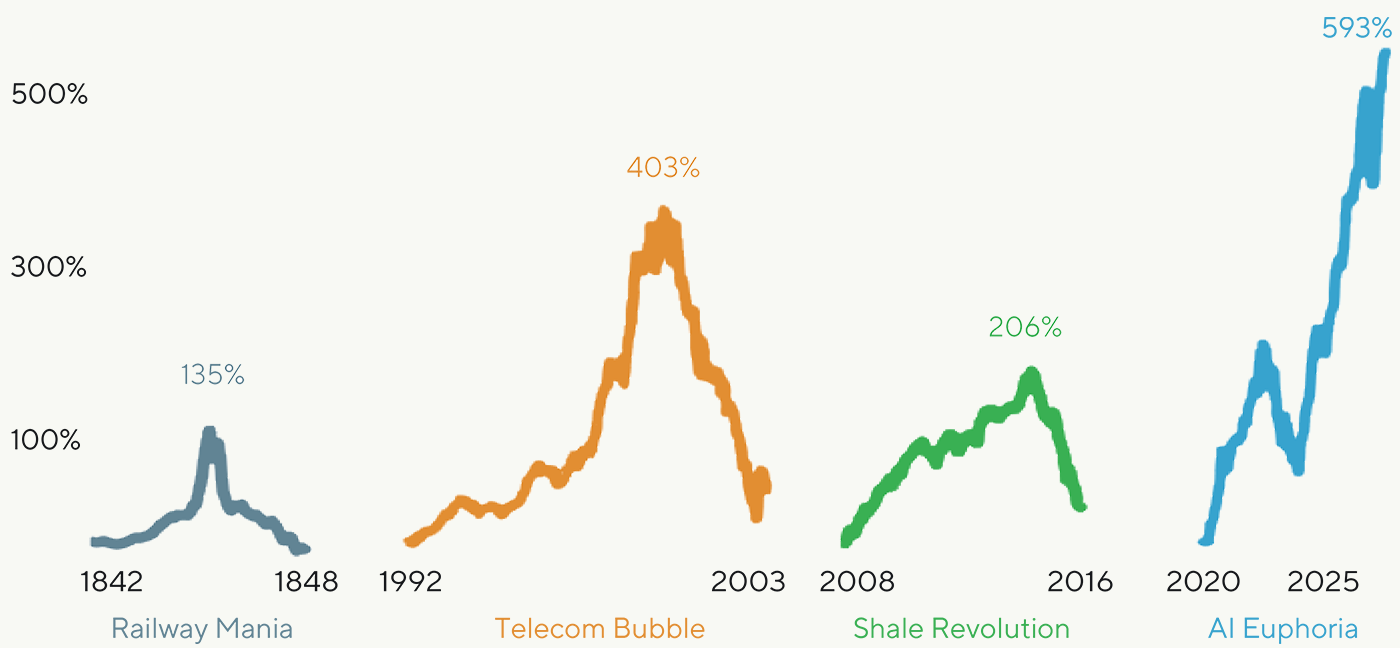
Source: GQG Partners LLC (chart), BofA Research Investment Committee, Global Financial Data, Bloomberg, Odlyzko (2010) (data). Data as of September 2025. Note: Railways = UK top 100 transports and British Railway Share Prices; Telecom = Nasdaq; Shale Revolution = AMZ Index; AI = Mag 7. You cannot invest directly in an index. PAST PERFORMANCE MAY NOT BE INDICATIVE OF FUTURE RESULTS.
Growth and innovation are not only occurring in AI-related spaces. In our view, these things are simply being ignored given the massive numbers being thrown around in the AI space, regardless of the likelihood of those figures being realized. We never want to accept a reduction in relative risk for an increase in absolute risk.
Just as there are no atheists in foxholes, our view is that there are also no atheists at 20x price to sales. Our view is that this type of extreme sentiment reflects a market that is meaningfully complacent in the face of a litany of issues for one of the largest exposures across global indexes. Remember, data is best used as an ensemble, and we do not get overly fixated on any one metric. However, at present, the ensemble is growing, and the risks are piling up, in our view. Temperance, rather than exuberance, should dictate the course of action at this time, and temperate we shall remain.
As always, thank you for your support.
Rajiv Jain
Chairman & Chief Investment Officer
GQG Partners LLC
END NOTES
1”Chinese AI models enter global top 10 in text generations rankings”. Tech In Asia. 10 September 2025.
2Catmull, Jaime. ”MIT Says 95% Of Enterprise AI Fails — Here’s What The 5% Are Doing Right”. Forbes. 22 August 2025.
3Jin, Berber. ”OpenAI Unveils Plans for Seemingly Limitless Expansion of Computing Power”. Wall Street Journal. 23 September 2025.
4Chancellor, Edward. Devil Take the Hindmost. Pgs. 123-124.
5Marcus, Gary. ”OpenAI’s Waterloo?”. Marcus on AI. 14 August 2025.
6”Samsung, SK Hynix shares leap after OpenAI chip deal”. Reuters. 2 October 2025.
7McLean, Bethany. “AI will trigger financial calamity. It’ll also remake world.” The Washington Post. 3 October 2025.
8Forgash, Emily and Ghosh, Agnee. “OpenAI, Nvidia Fuel $1 Trillion AI Market With Web of Circular Deals”. Bloomberg. 7 October 2025.
9Brown, Eliot and Olson, Bradley. “OpenAI’s Funding Challenges Loom Over Oracle, Broadcom Deal Spree”. The Wall Street Journal. 11 September 2025.
10Tunguz, Thomas. “Circular Financing: Does Nvidia’s $110B Bet Echo the Telecom Bubble?” Tom Tunguz. 3 October 2025.
11Adarlo, Sharon. “Residents Shut Down Google Data Center Before It Can Be Built”. Futurism. 28 September 2025.
12FE Business. “Adani Ports cargo grows 11% in September, rail logistics hits record in H1 FY26”. Financial Express. 3 October 2025.
13”The Digital Revolution in the Brazilian Banking Industry: A Decade of Transformation”. Galileo-FT. 19 May 2025.
DEFINITIONS
CapEx (capital expenditure) refers to the funds a company uses to acquire, upgrade, or maintain long-term physical or intangible assets. Unlike operating expenses, which cover daily business costs, CapEx is an investment in assets expected to generate economic benefits for more than one year.
Earnings Per Share (EPS) is a measure of a company’s profitability, calculated by dividing quarterly or annual income (minus dividends) by the number of outstanding stock shares.
The price-to-sales (P/S) ratio is a financial metric that compares a company’s market capitalization to its total revenue over a 12-month period.
IMPORTANT INFORMATION
This webpage may be distributed by GQG Partners LLC and its affiliates (collectively “GQG”).
The information provided on this website does not constitute investment advice and no investment decision should be made based on it. Neither the information contained in this document or in any accompanying oral presentation is a recommendation to follow any strategy or allocation. In addition, neither is it a recommendation, offer or solicitation to (i) sell or buy any security, (ii) purchase shares in any investment fund that GQG may sponsor, offer or manage, (iii) establish any separately managed account, or (iv) implement any investment advice. It should not be assumed that any investments made or recommended by GQG in the future will be profitable or will equal the performance of any securities discussed herein. Before making any investment decision, you should seek expert, professional advice, including tax advice, and obtain information regarding the legal, fiscal, regulatory and foreign currency requirements for any investment according to the law of your home country, place of residence or current abode.
This webpage reflects the views of GQG as at a particular time. GQG’s views may change without notice. Any forward-looking statements or forecasts are based on assumptions and actual results may vary.
GQG provides this information for informational purposes only. GQG has gathered the information in good faith from sources it believes to be reliable, including its own resources and third parties. However, GQG does not represent or warrant that any information, including, without limitation, any past performance results and any third-party information provided, is accurate, reliable, or complete, and it should not be relied upon as such. GQG has not independently verified any information used or presented that is derived from third parties, which is subject to change. Information on holdings, allocations, and other characteristics is for illustrative purposes only and may not be representative of current or future investments or allocations.
The information contained on this website is unaudited. It is published for the assistance of recipients but is not to be relied upon as authoritative and is not to be substituted for the exercise of one’s own judgment. GQG is not required to update the information contained in these materials, unless otherwise required by applicable law. No portion of this document and/or its attachments may be reproduced, quoted or distributed without the prior written consent of GQG.
Past performance may not be indicative of future results. Performance may vary substantially from year to year or even from month to month. The value of investments can go down as well as up. Future performance may be lower or higher than the performance presented and may include the possibility of loss of principal. It should not be assumed that investments made in the future will be profitable or will equal the performance of securities listed herein.
Any account or fund advised by GQG involves significant risks and is appropriate only for those persons who can bear the economic risk of the complete loss of their investment. There is no assurance that any account or fund will achieve its investment objectives. Accounts and funds are subject to price volatility and the value of a portfolio will change as the prices of investments go up or down. Before investing in a strategy, you should consider the risks of the strategy as well as whether the strategy is appropriate based upon your investment objectives and risk tolerance.
There may be additional risks associated with international and emerging markets investing involving foreign, economic, political, monetary, and/or legal factors. International investing is not for everyone. You can lose money by investing in securities.
GQG Partners LLC is a wholly owned subsidiary of GQG Partners Inc., a Delaware corporation that is listed on the Australian Securities Exchange (ASX: GQG). GQG Partners LLC and its affiliates provide certain services to each other.
GQG Partners LLC is registered as an investment adviser with the US Securities and Exchange Commission. Please see its Form ADV Part 2, which is available upon request, for more information.
INFORMATION ON BENCHMARKS
The S&P 500® Index is a widely used stock market index that can serve as a barometer of US stock market performance, particularly with respect to larger capitalization stocks. It is a market-weighted index of stocks of 500 leading companies in leading industries and represents a significant portion of the market value of all stocks publicly traded in the United States.
The A100 Rental Index tracks the daily hourly rental price of NVIDIA A100 graphics processing units (GPUs).
The H100 Rental Index tracks the hourly cost of renting an NVIDIA H100 Graphics Processing Unit (GPU).
The Alerian MLP Index (AMZ) is the leading gauge of energy infrastructure Master Limited Partnerships (MLPs). The capped, float-adjusted, capitalization-weighted index, whose constituents earn the majority of their cash flow from midstream activities involving energy commodities.
The Nasdaq Index, most commonly the Nasdaq Composite, is a market capitalization-weighted stock market index that tracks nearly all stocks listed on the Nasdaq stock exchange. It is heavily weighted toward the technology sector but also includes companies from other sectors like consumer discretionary and healthcare. As a widely followed benchmark, it provides an indicator of the performance of the technology-driven parts of the U.S. economy.
You cannot invest directly in indices, which do not take into account trading commissions and costs.
NOTICE TO RECIPIENTS IN AUSTRALIA & NEW ZEALAND
The information in this document is issued and approved by GQG Partners LLC (“GQG”), a limited liability company and authorised representative of GQG Partners (Australia) Pty Ltd, ACN 626 132 572, AFSL number 515673. This information and our services may be provided to wholesale and retail clients (as defined in section 761G of the Corporations Act 2001 (Cth)) domiciled in Australia. This document contains general information only, does not contain any personal advice and does not take into account any prospective investor’s objectives, financial situation or needs. In New Zealand, any offer of a Fund is limited to ‘wholesale investors’ within the meaning of clause 3(2) of Schedule 1 of the Financial Markets Conduct Act 2013. This information is not intended to be distributed or passed on, directly or indirectly, to any other person.
© 2025 GQG Partners LLC. All rights reserved. Data presented as at 30 September 2025 and denominated in US dollars (US$) unless otherwise indicated.
CIOPR 3Q25-RTL