
Evolution of Active ETFS
’93 to Infinity
The first US ETF was launched in January 1993 to track the S&P 500.1 ETFs experienced tepid growth in the first few years after their launch but started to gain wider adoption over time, eventually reaching $1 trillion in assets nearly 18 years after their debut.
After this slow start, US-domiciled ETFs experienced meteoric growth starting in the mid-2010s, with total ETF assets hitting more than $10.3 trillion as of the end of 2024.2
Exchange-Traded Funds Total Financial Assets
PASSIVE ETFS MAKE WAY fOR ACTIVE
In the early days of the ETF, the vehicle was mostly associated with passive strategies that aimed to replicate the performance of major indexes. In fact, as recently as 2019, actively managed ETFs represented just over 2% of the US ETF market.3
In 2019, the Securities and Exchange Commission (SEC) approved Rule 6c-11, otherwise known as the “ETF Rule,” which permitted ETF providers to create and redeem ETF shares with custom baskets of securities. This change streamlined the SEC approval process for active ETFs, and since then, the active ETF market has experienced consecutive record-breaking years for launches and growth in assets under management (AUM).3
New Active ETF Launches and Assets Have Swelled Since the 2019 ETF Rule
Active ETF Launches Since the 2019 “ETF Rule”
Active ETF Assets Since the 2019 “ETF Rule”
MORE ACTIVE ETFS HAVE NOT RESULTED IN BETTER INVESTOR OUTCOMES
Despite having more active ETF options than ever before, most investors using these products have not enjoyed excess returns above index-tracking peers.
Of the 407 active US Equity ETFs that have entered the market since 31 July 2019, only 69 have a five-year track record. Of those remaining ETFs, only seven have a track record of producing positive alpha† versus the S&P 500, and the GQG US Equity ETF is the top performing ETF among them.
The goal of our active strategies is to outperform their respective benchmarks and generate alpha for investors over the long term.
Long-Term Performance
Source: GQG Partners LLC, Morningstar. Data for the time period between 31 July 2019 through 30 June 2025 and represents alpha. PAST PERFORMANCE MAY NOT BE INDICATIVE OF FUTURE RESULTS. The performance data quoted represents past performance, and current returns may be higher or lower. Past performance does not guarantee future results. View additional fund performance and information.
THE CASE FOR ACTIVE US EQUITY ETFS
PASSIVE US EQUITY ETFS CAN BE HIGHLY CONCENTRATED BUT NOT ADAPTABLE
Investors choosing a passive, market-capitalization-weighted US equity ETF may believe they are getting a well-diversified basket of securities that broadly reflects the growth of the US economy. However, these passive ETFs are not as diversified as some investors may believe. In fact, concentration in the S&P 500 is at its highest level in decades, with the top five mega-cap companies making up 25% of the index as of late June 2025.
Percent Share of the S&P 500 by the Top 3 and Top 5 Companies By Market Capitalization
This means that market-capitalization-weighted passive US equity ETFs are making an increasingly large bet on the performance of a handful of companies but lack the ability to deviate from the benchmark if earnings do not materialize or if valuations reach what we consider to be excessive heights.
This is not to say that we believe concentrated portfolios are poor choices for investors—quite the opposite. We are high-conviction stock pickers at heart. Rather, we believe the problem lies in a passive ETF’s inability to adapt to changing market conditions when company fundamentals or macroeconomic conditions deteriorate.
Sector Weightings in the S&P 500 Have Stayed Relatively Stable Over Time
While concentration in the largest US companies in market-capitalization-weighted index-based ETFs has increased over recent years, sector weightings in the S&P 500 have stayed relatively stable outside of major macroeconomic events, like the dotcom bust or the great financial crisis.
S&P 500 Historical Sector Weightings
GQGU is Designed to be Adaptable
Meanwhile, GQGU employs an adaptable approach to investing in the largest and most liquid securities in the US equity market. We believe our approach allows us to identify attractive investment opportunities in an ever-adapting investment landscape while also recognizing the risks involved, all within the ETF vehicle.
GQGU Historical Sector Weightings
IMPORTANT DIFFERENCES BETWEEN MUTUAL FUNDS AND ETFS
Investors should consider the differences between mutual funds and ETFs when selecting an investment vehicle. Both ETFs and mutual funds offer diversification benefits, allowing investors to access exposure to a portfolio of securities in a single trade.
However, mutual funds and ETFs have notable differences.
| Features | Active ETF | Passive ETF | Active Mutual Fund |
| Outperformance potential3 | ✔ | ✔ | |
| Active management | ✔ | ✔ | |
| Downside risk management | ✔ | ✔ | |
| Adaptable to changing markets | ✔ | ✔ | |
| May invest in holdings outside of benchmark | ✔ | ✔ | |
| Tax efficiency4 | ✔ | ✔ | |
| Intraday trading5 | ✔ | ✔ | |
| Daily holdings transparency6 | ✔ | ✔ | |
| Low fees7 | ✔ | ✔ | ✔ |
| Diversification8 | ✔ | ✔ | ✔ |
| Low investment minimums | ✔ | ✔ | ✔ |
3While active ETFs seek to outperform their benchmark, there is also the risk that the ETF may underperform the benchmark. Past performance is no guarantee of future results.
4“In-Kind” creation/redemption process for ETFs allows for the potential for reduced taxes for capital gains in accounts that are not tax-deferred.
5ETFs can be bought or sold during the trading day while mutual funds only trade once per day at that day’s net asset value when the stock market closes.
6Not all active ETFs are as transparent as passive, but both tend to be more transparent than a mutual fund.
7While both active and passive ETFs typically have lower fees than mutual funds, passive ETFs generally have lower fees.
8Diversification does not guarantee profit or protect against loss in a declining market.
| Benefits of ETFs | Benefits of Mutual Funds |
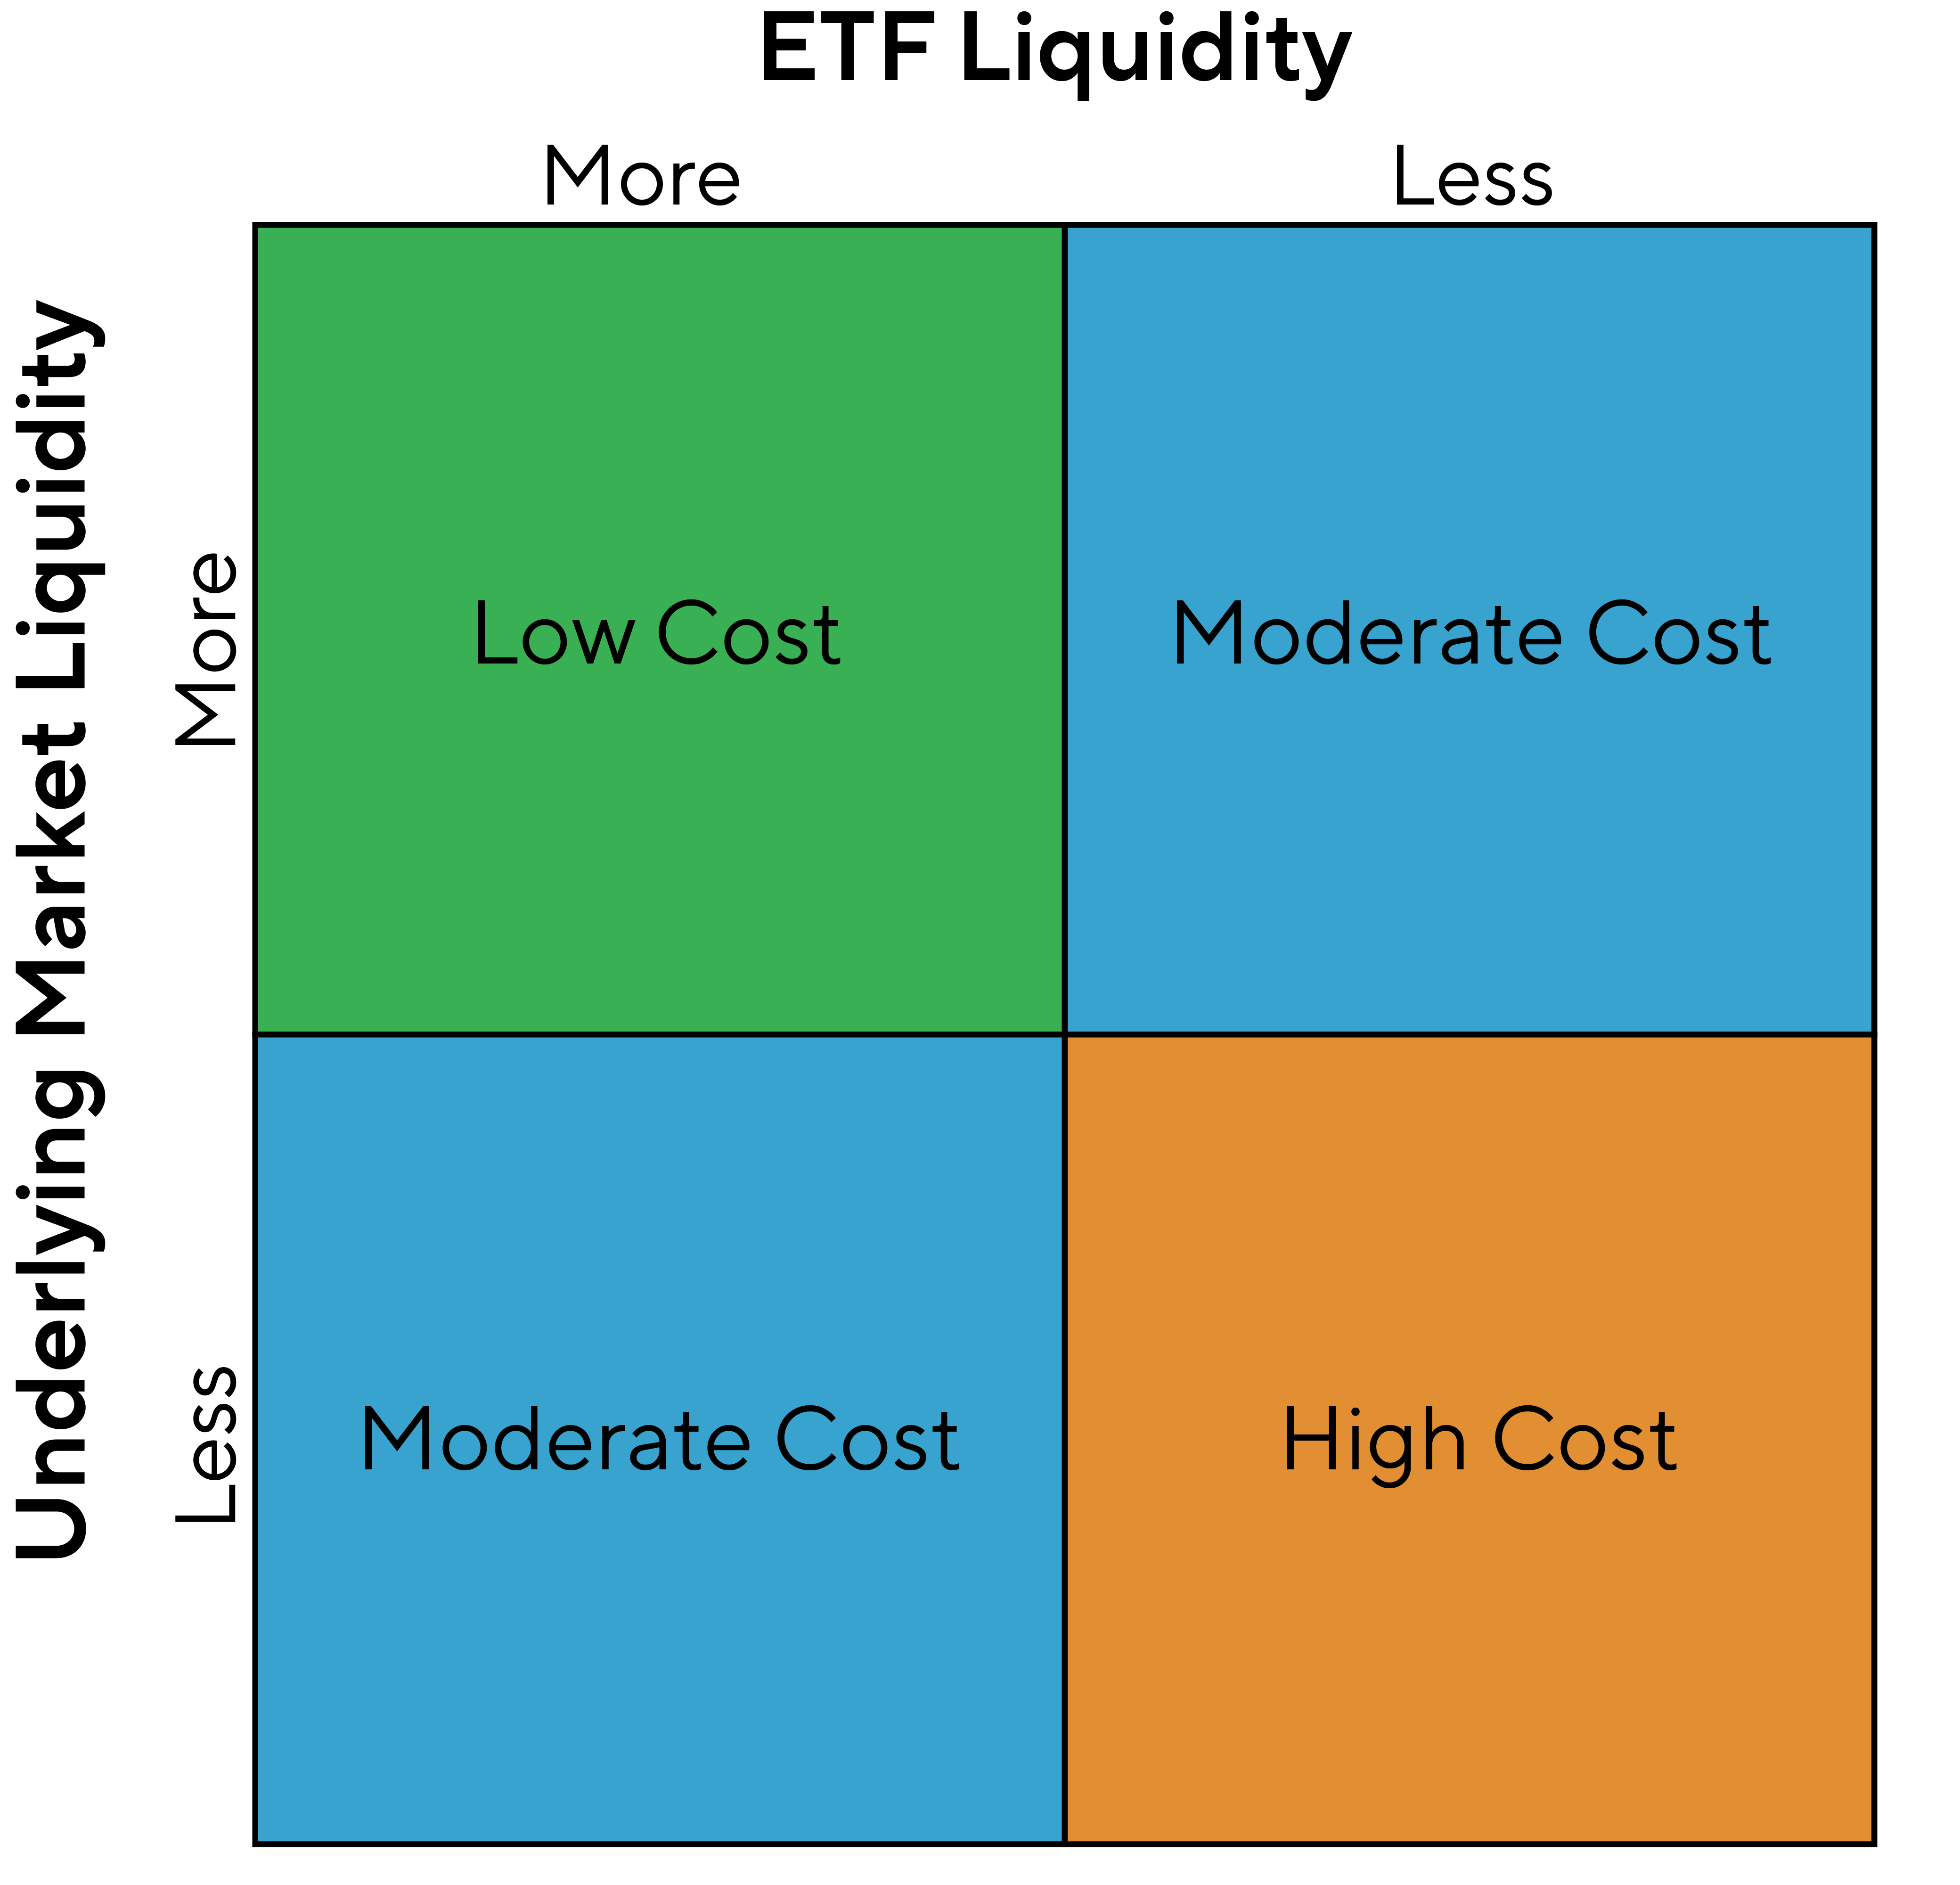
| - Tax Efficiency: The mechanics of the ETF redemption process limit capital gains distributions. When ETF shares are redeemed by an authorized participant (AP), transactions between the fund sponsors and AP are in-kind and are not considered as a taxable event for the ETF. During the redemption process, ETF managers can provide APs the tax lots with the lowest cost basis and most appreciation while leaving higher-priced securities within the ETF. - Low Fees: ETFs do not have purchase fees, but often include a charge for commissions, and ETFs do not charge annual 12b-1 fees, unlike some mutual funds. - Flexible Trading: ETFs trade throughout the day on an exchange like stocks, while mutual funds trade once per day. - Daily Transparency: ETFs generally disclose their holdings daily, while mutual funds generally disclose on a monthly or quarterly basis | - Can Close to New Investors: Mutual funds can close to help preserve strategy integrity and performance, while ETFs cannot.9 - Trading Costs: Mutual funds generally do not have a bid-ask spread and are priced at the end of the trading day based on their net asset value. As liquidity can impact ETF costs, investors should consider strategy capacity when selecting an ETF. ETFs with a reasonably diversified portfolio of liquid, frequently traded holdings—like mega- to large-cap US equities—generally work best in the ETF wrapper. When liquidity of an ETF or its underlying securities is thin, bid-ask spreads can widen, thereby reducing returns and increasing costs to investors. |
9Features like fund closure may benefit existing investors, but limit access for new investors and may reduce liquidity or scale benefits. There are other benefits and risks of both mutual funds and ETFs. This list is not inclusive of all potential benefits or risks.
Source: GQG Partners LLC, Morningstar.
ADOPTION OF ETFS BY INVESTOR TYPE
ETF adoption continues to grow across all investor types. As of 2024, ETF adoption was highest among Financial Advisors and Institutional Investors with room for growth.
Source: GQG Partners LLC, State Street Global Advisors, 2024 ETF Impact Survey. Data collected between 1 April 2024 through 25 April 2024.
Primary Uses of ETFs, According to Investors
ETF investors most often cite diversification benefits and cost efficiency as their top reasons for using the vehicle.
| Top Three Reasons for Using or Recommending ETFs | |||||
| Individual Investors | Financial Advisors | Institutional Investors | |||
| Diversification Benefits | 49% | Cost Efficiency | 44% | Cost Efficiency | 57% |
| Trading Flexibility | 47% | Diversification Benefits | 43% | Diversification Benefits | 54% |
| Lower Cost/Expense Ratio | 39% | Trading Flexibility | 43% | Cash/Liquidity Management | 46% |
Source: GQG Partners LLC, State Street Global Advisors, 2024 ETF Impact Survey. Data collected between 1 April 2024 through 25 April 2024.
This material is for informational purposes only. It does not constitute investment advice or a recommendation to buy or sell any security.
References to institutional investors are included solely to describe the investment landscape and do not imply endorsement, validation, or suitability of any investment strategy for retail investors.
Please note:
– Institutional investors often have access to different investment terms, share classes, and due diligence resources that are not available to retail investors.
– Their participation in a fund or strategy does not guarantee performance, reduce risk, or ensure suitability for individual investors.
– Retail investors should not interpret institutional involvement as a signal of safety, quality, or future success.
A balanced evaluation of both risks and potential rewards is essential when considering any investment.
| TOTAL RETURNS AS OF 30 JUNE 2025 | 1 YR | 3 YRS | 5 YRS | SINCE INCEPTION* (01 AUG 19) |
| GQGU NAV % | -0.09 | 13.93 | 14.60 | 15.15 |
| GQGU Market Price % | -0.09 | 13.93 | 14.60 | 15.15 |
| S&P 500 Index % | 15.16 | 19.71 | 16.64 | 14.79 |
Total Annual Fund Operating Expenses (Gross) 0.59%. Total Annual Fund Operating Expenses 0.49%. GQG Partners is contractually waiving fees until 31 July 2026.
The performance data quoted above represent past performance and do not guarantee future results. Current performance of the Fund may be lower or higher than the performance quoted. Performance data current to the most recent month end may be obtained by clicking here. The investment return and principal value of an investment will fluctuate so that an investor’s shares, when redeemed, may be worth more or less than their original cost. Returns greater than one year are annualized. Net returns may reflect waiver agreements to limit the Fund’s expenses and are reflected in the performance shown. Performance would further be reduced if the waiver agreements were not in effect.
*The GQG US Equity ETF (the “ETF”) commenced operations on 14 July 2025. Performance shown for periods prior to this date reflects the returns of the GQG Partners US Equity Fund (the “Predecessor Fund”) through 11 July 2025, with an adjustment for ETF fees. Market Price returns prior to 11 July 2025 reflect the Predecessor Fund’s NAV returns. The Predecessor Fund, which began on 31 July 2019, was managed in a materially equivalent manner using substantially similar investment objectives, policies, and restrictions as the ETF, but was not subject to the same investment and tax requirements. The ETF has adopted the Predecessor Fund’s inception date of 31 July 2019, for performance reporting purposes. Past performance, before and after taxes, does not guarantee future results.
Additional information about the Predecessor Fund and the reorganization may be found in the GQG US Equity ETF Prospectus.
END NOTES
1 Bojinov, Stoyan. “A Brief History of ETFs”. VettaFi. 24 June 2015.
2 Federal Reserve Bank of St. Louis. “Exchange-Traded Funds; Total Financial Assets, Market Value Levels.”
3 Morningstar. Guide to US Active ETFs. 23 April 2024.
You should carefully consider the investment objective, risks, charges, and expenses of the Fund before investing. The Fund’s prospectus and summary prospectus contain this and other important information about the Fund, which can be obtained by dialing +1 (866) 362-8333 or visiting gqg.com/documents. Please read the prospectus carefully before investing. The Fund’s Statement of Additional Information can also be obtained by dialing +1 (866) 362-8333 or visiting gqg.com/documents.
Important Information
†Alpha represents the fund’s risk-adjusted excess return relative to its benchmark, calculated using Jensen’s Alpha methodology. Jensen’s Alpha is a performance measure that adjusts a portfolio’s return for the level of market risk taken, using the formula: Alpha = Portfolio Return − [Risk-Free Rate + Beta × (Market Return − Risk-Free Rate)].
Understanding Investment Risk
Investing involves risks, including loss of principal. There is no guarantee the Fund will achieve its stated objective. Investments in the United States may result in the Fund being more susceptible to economic, political, regulatory, or other events or conditions affecting issuers within the United States. They may be subject to greater price volatility and risk of loss than a fund holding more geographically diverse investments. International investments may also be susceptible to the same events or conditions as well as unfavorable fluctuations in currency values, or differences in generally accepted accounting principles in other nations. The Fund is non-diversified. In addition to the normal risks associated with investing, investments in small- and mid-size companies may be more volatile and less liquid than those of large companies. The Fund may invest in initial public offerings (IPOs) whose share values can vary widely due to limited trading experience and company information. Investing in IPOs carries higher risks and costs compared to established companies, along with market and liquidity risks. The Fund may trade frequently, increasing transaction costs and taxes due to short-term gains. Its performance depends on the Adviser’s investment decisions, which may not always be accurate, potentially leading to underperformance compared to similar funds.
Any account or fund advised by GQG involves significant risks and is appropriate only for those persons who can bear the economic risk of the complete loss of their investment. There is no assurance that any account or fund will achieve its investment objective.
Exchange Traded Funds (ETFs) are bought and sold through exchange trading at market price (not NAV) and shares are not individually redeemed from the fund. Shares may trade at a premium or discount to their NAV in the secondary market. Brokerage commissions will reduce returns.
Premium/Discount is the percent difference between the Market price and the NAV price. Market price returns are based on the official closing price of an ETF share or, if the official closing price isn’t available, the midpoint between the national best bid and national best offer (“NBBO”) as of the time the ETF calculates current NAV per share. NAVs are calculated using prices as of 4:00 PM Eastern Time.
The GQG US Equity ETF is an actively managed ETF that does not seek to replicate the performance of the S&P 500 Index.
SEI Investment Distribution Co. (SIDCO) is the distributor for the GQG US Equity ETF. SIDCO is not affiliated with GQG Partners. Check the background of SIDCo on FINRA’s BrokerCheck.
The information provided in this document does not constitute investment advice and no investment decision should be made based on it. Neither the information contained in this document or in any accompanying oral presentation is a recommendation to follow any strategy or allocation. In addition, neither is it a recommendation, offer or solicitation to (i) sell or buy any security, (ii) purchase shares in any investment fund that GQG may sponsor, offer or manage, (iii) establish any separately managed account, or (iv) implement any investment advice. It should not be assumed that any investments made or recommended by GQG in the future will be profitable or will equal the performance of any securities discussed herein. Before making any investment decision, you should seek expert, professional advice, including tax advice, and obtain information regarding the legal, fiscal, regulatory and foreign currency requirements for any investment according to the law of your home country, place of residence or current abode.
This document reflects the views of GQG as at a particular time. GQG’s views may change without notice. Any forward-looking statements or forecasts are based on assumptions and actual results may vary.
GQG provides this information for informational purposes only. GQG has gathered the information in good faith from sources it believes to be reliable, including its own resources and third parties. However, GQG does not represent or warrant that any information, including, without limitation, any past performance results and any third-party information provided, is accurate, reliable, or complete, and it should not be relied upon as such. GQG has not independently verified any information used or presented that is derived from third parties, which is subject to change. Information on holdings, allocations, and other characteristics is for illustrative purposes only and may not be representative of current or future investments or allocations.
The information contained in this document is unaudited. It is published for the assistance of recipients, but is not to be relied upon as authoritative and is not to be substituted for the exercise of one’s own judgment. GQG is not required to update the information contained in these materials, unless otherwise required by applicable law.
Any account or fund advised by GQG involves significant risks and is appropriate only for those persons who can bear the economic risk of the complete loss of their investment. There is no assurance that any account or fund will achieve its investment objectives. Accounts and funds are subject to price volatility and the value of a portfolio will change as the prices of investments go up or down. Before investing in a strategy, you should consider the risks of the strategy as well as whether the strategy is appropriate based upon your investment objectives and risk tolerance.
INFORMATION ABOUT BENCHMARKS
The S&P 500 Index is a float-adjusted market cap weighted equity index of stocks of 500 leading companies in the United States. The S&P 500 Index is a product of S&P Dow Jones Indices LLC, a division of S&P Global, or its affiliates (SPDJI) and has been licensed for use by GQG Partners LLC. Standard & Poor’s® and S&P® are registered trademarks of Standard & Poor’s Financial Services LLC, a division of S&P Global (S&P); Dow Jones® is a registered trademark of Dow Jones Trademark Holdings LLC (Dow Jones). GQG Partners LLC is not sponsored, endorsed, sold or promoted by SPDJI, Dow Jones, S&P, their respective affiliates, and none of such parties make any representation regarding the advisability of investing in such product(s) nor do they have any liability for any errors, omissions, or interruptions of the S&P 500 Index.
Information about benchmark indices is provided to allow you to compare it to the performance of GQG strategies. Investors often use these well-known and widely recognized indices as one way to gauge the investment performance of an investment manager’s strategy compared to investment sectors that correspond to the strategy. However, GQG’s investment strategies are actively managed and not intended to replicate the performance of the indices: the performance and volatility of GQG’s investment strategies may differ materially from the performance and volatility of their benchmark indices, and their holdings will differ significantly from the securities that comprise the indices. You cannot invest directly in indices, which do not take into account trading commissions and costs. Net total return indices reinvest dividends after the deduction of withholding taxes, using (for international indices) a tax rate applicable to non-resident institutional investors who do not benefit from double taxation treaties.