
Key Takeaways
The software industry, much like the energy sector in 2014, is experiencing a boom-and-bust cycle, driven by easy capital and excesses of the past decade, which have resulted in weak, unprofitable business models for many new software firms
Despite significant drawdowns, valuations remain high, growth is decelerating, and free cash flow is expected to decline, pointing to a potential multi-year downturn in the software industry
To become more sustainable, software companies should consider practices such as training customers to accept regular price increases, cutting non-profitable projects, and tying compensation to business performance, but achieving these changes may be a challenging cultural shift for many companies
The software bubble appears to have popped but not everyone seems convinced yet. Getting off the train can be difficult as buying the dip in software has generally worked over the past decade. A similar dynamic took place in the energy sector boom-and-bust cycle in 2014. In fact, looking back at that period, we find many lessons from the US shale boom that are broadly applicable to the recent software boom. At a high level, we think both industries are representative of the excesses of the last decade driven by easy capital, as well as the dangers of ignoring capital cycles.
There seems to be a new disruptive technology that gets the markets excited in every cycle. A decade ago, it was hydraulic fracturing (which we will refer to as shale). In recent years, it has been software. In both cases, the market initially encouraged growth at all costs, highlighting strong unit economics and adjusted valuation metrics that made the industry look profitable and cheap.
Eventually, supply flooded into the sectors just as demand started to decelerate. As energy investors learned the hard way over the past decade, no sector is immune to the basic laws of supply and demand – including the technology sector.
Looking at the software industry today, market participants seem to be reconnecting with reality, but they seem to have mixed views over the depth and duration of the downturn as discussions have shifted to whether the worst is over. The median drawdown year-to-date of the 46 Russell 1000 software companies founded post-2000 has been 61 per cent through November (see Exhibit 1). Despite the eye-popping drawdown, valuations remain an issue, in our view. The median company in this cohort still trades at 6.1x revenue. Only 22 per cent of the cohort is GAAP profitable.
We see some fundamental issues with the industry. Nearly every software company has demonstrated broad-based growth deceleration from 2021 levels – the Russell 1000 cohort from above has a median revenue growth deceleration of 9 per cent over the last twelve months. The story sold during the go-go years of 2020 has not played out – as it turns out, not every software company will become the next Microsoft, and software has not eaten the world.
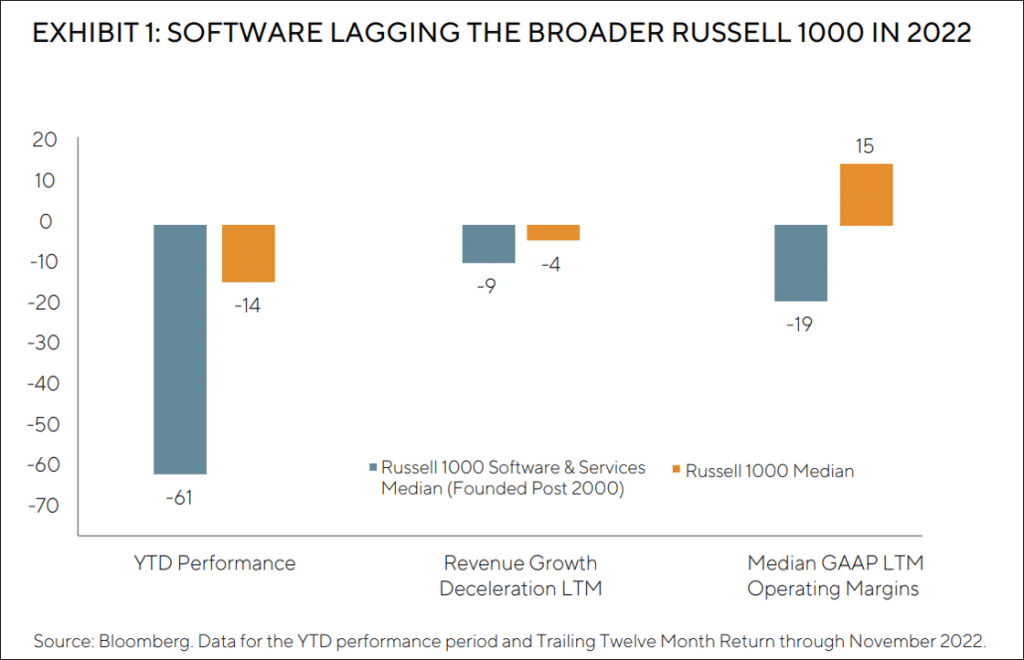
The harsh reality is that most of the newer software companies have not built sustainable business models, in our opinion. Despite much excitement and broader industry growth, these companies have not delivered meaningful profit growth. The median GAAP LTM operating margin in the Russell 1000 cohort is still -19 per cent. Many investors may quote free cash flow multiples, but the open secret has been most of this ‘free cash flow’ is actually share-based compensation that is highly dependent on share prices (which have melted). If these companies could not become profitable during a massive boom period with strong software demand, when will they? We believe the combination of abundant capital, low interest rates, and strong industry growth during the past decade has resulted in weak, unprofitable business models for a number of newer software firms.
To be clear, we have owned select cloud software businesses in the past before cutting back in late 2021, especially as we started seeing signs of deceleration and lack of margin improvement. We believe the continued decline in growth has supported our decision to exit those names. Ahead of a difficult 2023 backdrop where software demand seems to be weakening, we expect revenue growth to further decelerate, margins to further compress, and free cash flow to decline. In other words, a toxic mix for any investment, in our opinion.
LESSONS FROM US SHALE – A CLASSIC CAPITAL CYCLE
THE SIMILARITIES
Both industries were considered secular growth stories despite operating within lower growth areas – oil as a 1 to 2 per cent industry grower and information technology (IT) spend as a 4 to 5 per cent grower. Excitement about a new technology was central to the investment case for both industries. In the case of US shale, engineering technology revolving around hydraulic fracking and horizontal well drilling allowed oil operators to access oil resources that were previously difficult to harvest at lower costs. In the case of software companies, the advent of cloud architecture and better internet infrastructure allowed easier deployment, iteration, and adoption of software.
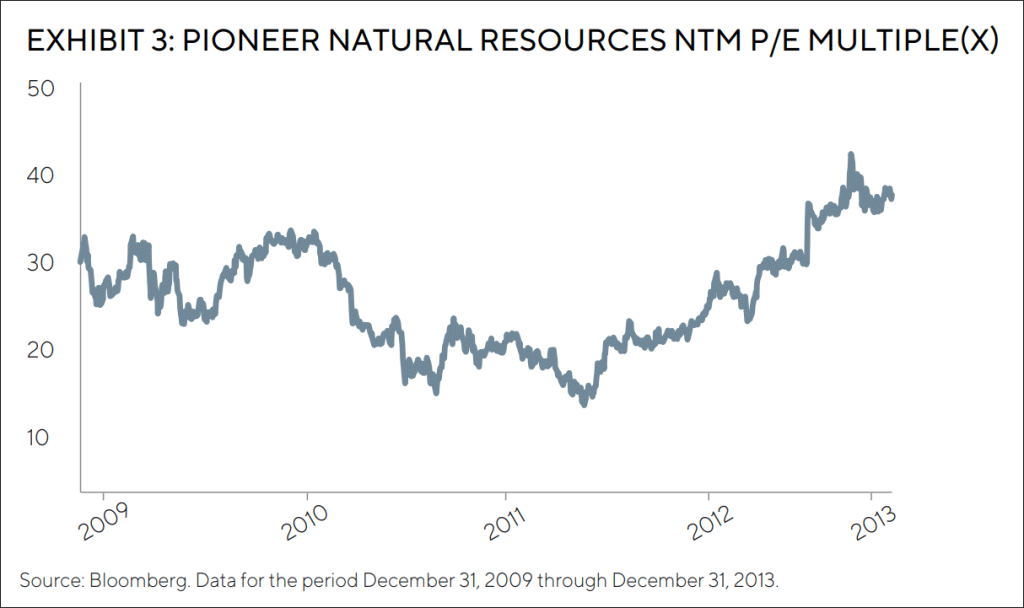
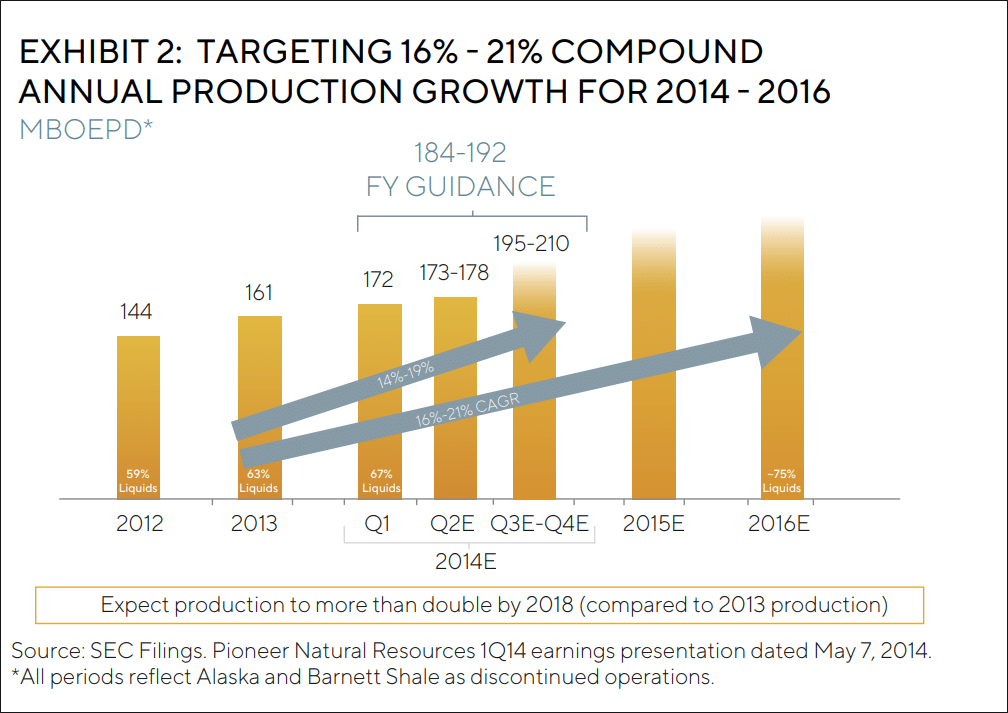
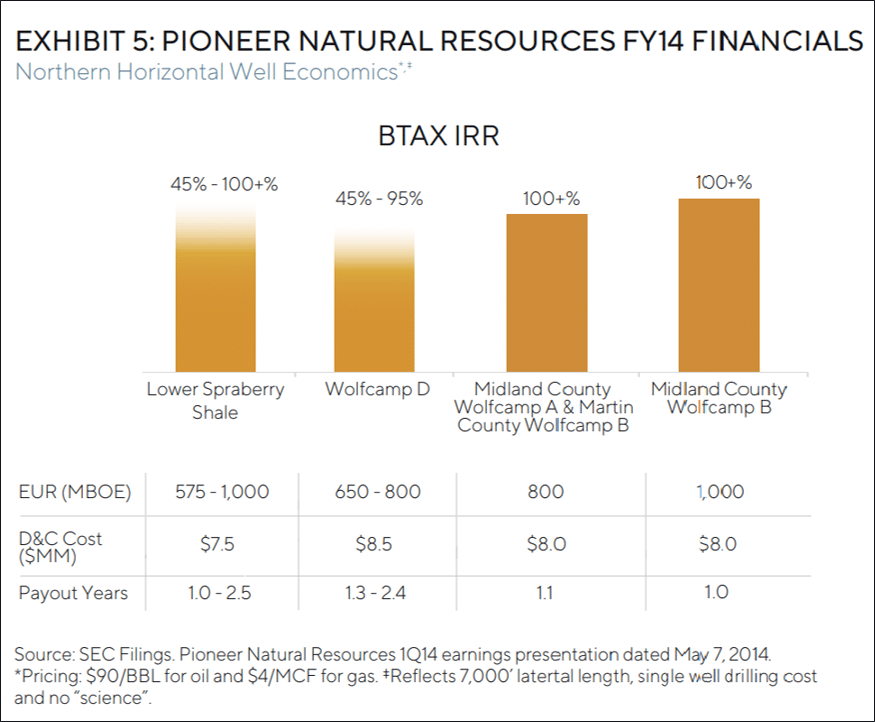
One major shale producer, Pioneer Natural Resources, targeted 16 to 21 per cent annual production growth in 2014. As one broker noted back in 2015: “In a $75-80 oil world, PXD (Pioneer Natural Resources) can grow close to 20% for a decade and, hence, we view it as a large-cap must-own stock exiting this cycle, whenever you believe that is. We believe that clear bifurcation of US winners will attract capital and prevent PXD from getting ‘cheap’ on consensus metrics in a world where few assets are cheap.”1 As a result of this growth profile, the stock typically traded between 20x and 40x EPS during the shale boom. In our opinion, that sounds like the current pitch for software, as Gartner estimates >20 per cent cloud software growth in 2023 despite overall IT spending only growing 5 per cent.2
As investor enthusiasm increased, companies created new metrics such as ‘lifetime value to customer acquisition costs’ (LTV to CAC) in the case of software and ‘oil well IRRs’ in the case of US shale. Both pointed to stellar unit economics and non-GAAP metrics to distract from the lack of cash flow and profitability at the company level. Investors bought into the narrative, believing that profitability would inevitably come once companies scaled up. To quote one respected bulge bracket analyst in 2015, “we believe as shale matures and industry growth profiles taper, at various rates, E&P (exploration & production) FCF will inflect, growth will slow, and shareholder returns will increase: the same path followed by many large caps before them.”1
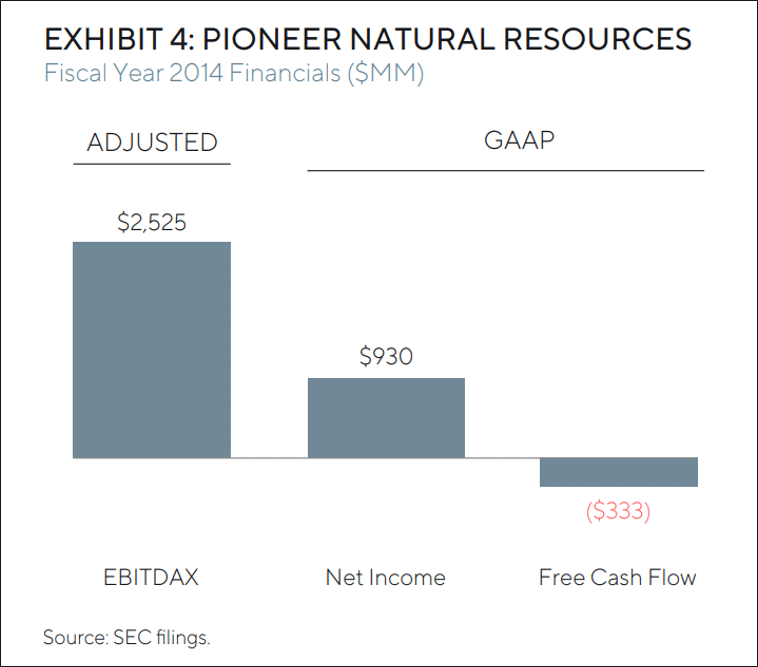
Those who followed the oil space back in the 2014 era probably recall optimistic projections of >100 per cent ‘well IRRs’ and EBITDAX valuation metrics (which conveniently ignored depletion, depreciation and amortization, and exploration expenses). Ultimately, these forecasted returns were difficult to realize as management teams and analysts failed to account for the significant fixed costs in the business and the implications to consolidated margins. We believe a similar mistake is being made with software today – the myopic focus on LTV to CAC misses the fact that the median Russell 1000 business spends ~20 per cent of revenue on research and development – excluding management overhead – weighing on consolidated margins.
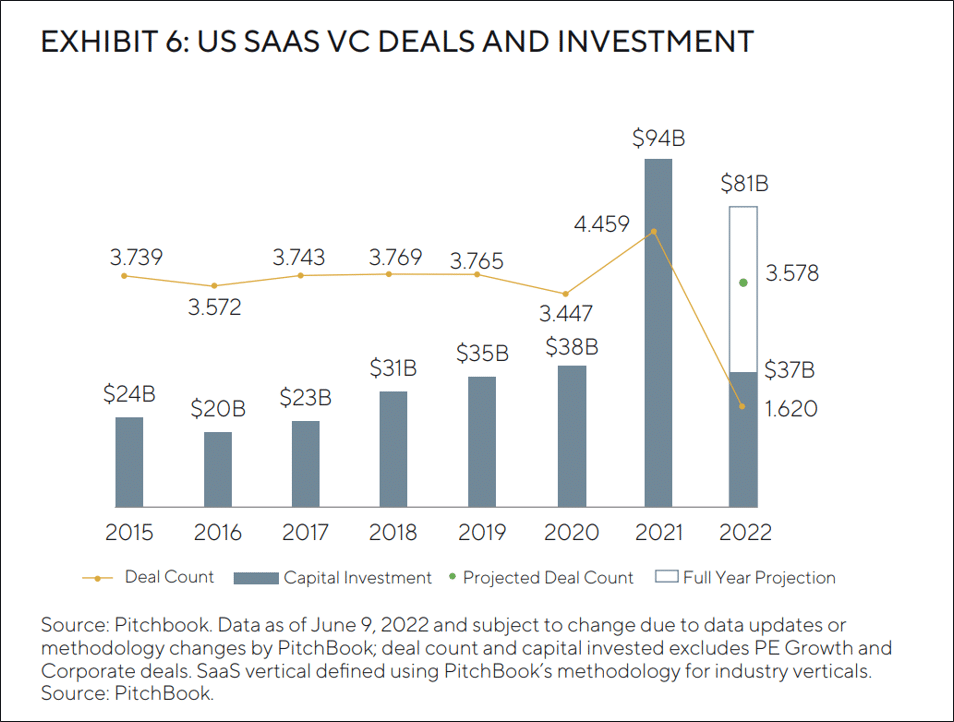
Ultimately, both industries turned to capital markets to fund losses. Hundreds of billions of dollars have entered both the US shale and software as a service (SaaS) industries over the last decade. For US shale, Deloitte estimates that from 2010 through 2020, industry free cash flow was negative $300 billion, relying on a combination of debt and equity to plug the cash flow gap.3 Similarly, in software, venture funding for US businesses has totaled greater than $300 billion since 2015. Even public companies have continued to rely on external financing: the Russell 1000 cohort issued ~$17 billion in share-based compensation over the last twelve months – which we view as the equivalent of equity financing, no different than if a company went to the equity markets and issued shares for cash. In other words, external capital entering the software industry has actually exceeded that of the then much-reviled shale industry.
THE BOOM AND BUST
For the shale companies, we believe weakening demand in the 2015 to 2016 era plus too much capital chasing supply growth resulted in a multi-year downturn. Eventually, these shale companies delivered on their original promise of meaningful production growth, better returns on capital, and lower costs – but not without significant pain in between. Pioneer Natural Resources only eclipsed its 2014 share price in 2022 – a lost decade for shareholders.
We see a similar situation playing out in software today. Demand is softening as the world leaves the 2020 technology boom and enters the reality of a potential 2023 slowdown. Lead times for sales cycles are already extending. 2023 IT budgets are likely now being set and coming in below the usual 5 per cent growth given economic slowdown fears. The implications here are deteriorating unit economics for software companies over the next few years as customer spend is increasingly scrutinized. We see a potential environment of decelerating revenue growth, declining margins, and contracting equity valuation multiples. A painful, multiyear downcycle seems likely in our view as investors recognize this new reality.
TECH’S ESG ISSUES: POOR GOVERNANCE
Poor governance at many software companies presents meaningful ESG risks, even if software optically checks off the boxes in the ‘environmental’ and the ‘sustainable’ categories. Technology investors have largely overlooked governance issues in the past given the strong revenue growth profile of software companies in an era of weak overall economic growth. However, now that the industry has hit challenging times, poor governance practices are more in focus. Management teams seem to be running away from issues instead of facing them headon. Examples of these poor practices include top-up compensation and sale processes.
Top-up compensation: Because talent had been so scarce on the software development side, companies would give out significant equity packages that vest over four years and usually at discounts to market prices. In the off-chance the share price ended up lower than expected, many employers would top-up and make up the difference with additional equity grants. It is a pretty good deal for the employee – unbounded upside and no downside. Equity shareholders, of course, are the losers in all of this because dilution ends up higher and GAAP margins end up lower. Zoom, one of many examples we can point to, has seen share-based compensation balloon to 27 per cent of revenue in the most recent quarter versus 10 per cent of revenue in 2020. GAAP operating margins peaked at 29 per cent in the quarter ending January 2021 but have declined to 6 per cent in the most recent quarter.
Sale processes: We have already seen many management teams throw in the towel and elect for take-privates. Previous darlings like Citrix and Avalara were recently purchased while a few others including Coupa have recently reached an agreement with a private equity company. Most of these take-private prices have been at meaningful discounts to all-time-highs, much to the detriment of public market investors. These take-privates have come after some deceleration in the fundamental businesses but represent poor governance, in our view. Management compensation oftentimes comes in the form of RSUs that get paid out instantly on a change-of-control. Rather than grinding it out, these management teams have elected to throw in the towel and sell the business. Regarding Avalara, in 2021 the board changed the management equity compensation mix to include 40 per cent RSUs that vested over four years under normal course of business, but instantly on a change-in-control.
We do not believe that boards nor management teams have been penalized for poor governance. On the contrary, many boards and management seem to be incentivized to execute on governance practices detrimental to shareholders. Unfortunately, we think governance violations will continue with impunity, another risk many investors have overlooked over the last decade, as many management teams and boards are not aligned with the interests of investors.
THE DIFFERENCES
Technology investors would point to one major difference between software companies and oil companies: pricing power. Oil is a commodity, whereas software can theoretically raise prices on customers due to the high switching costs. However, the reality is that most software companies have not actually flexed their pricing power.
At Salesforce, for example, pricing has not been a material factor for revenue growth in the past few years. Instead, the company elects to engage in cross-selling or upselling to grow spend within a customer. However, the ‘maintenance’ of said customer likely gets more expensive over time due to rising salaries, product development costs, and increased hardware, datacenter, and cloud costs. In short, the unit economics degrade over time, as evidenced by the decline in Salesforce’s gross margin from 80 per cent in 2010 to ~73 per cent in the most recent quarter. We believe the company’s margin profile and total revenue would look significantly different if they had flexed their theoretical pricing power.
CONCLUSION
We believe that understanding capital cycles is one of the most important aspects of investing. We have an adage at GQG: never underestimate capital seeking returns. Every sector, regardless of its current growth rate or theoretical pricing power, experiences a capital cycle at some point. The playbook tends to be surprisingly consistent across cycles: a new, fast-growing technology convinces market participants that “this time is different”, resulting in new capital entering the sector. To mask the deteriorating cash flow generation, companies and investors start using unit economics and non-GAAP metrics. However, every sector is cyclical on a long enough horizon, so supply typically overshoots once demand inevitably slows down. Having seen this cycle play out before, we believe software investors today are making the same mistake energy investors made a decade ago: overestimating demand and underestimating supply.
That being said, it is not all gloom and doom. Some shale companies adapted and ended up fulfilling their original promise. For example, Pioneer Natural Resources recently generated ~40 per cent operating margins and ~35 per cent annualized returns on capital at four times the production level from 2013; in other words, the production growth came through along with healthy margins.
Similarly, some of these software companies may eventually adapt to the new reality. If you were to ask us, the playbook to build these companies into more durable growth businesses is to unwind many of the excesses of the last decade. Here are some ideas:
- Train customers to accept price increases of at least 2 per cent per year. Price to value, not to cost.
- Ruthlessly cut pet-projects that have no demonstrable ROI.
- Tie share-based compensation and other variable compensation to how the business is performing instead of guaranteeing pay to better adjust cost structures in a variety of macro environments.
As always, we are open-minded to invest in companies that make tangible changes to their operating models and focus on generating sustainable profit growth. However, the cultural changes required to downshift to lower growth will likely be painful as capital markets have not enforced discipline in any meaningful way over the last decade.
It’s finally time for the rubber to meet the road, and unfortunately, we do not think most companies are prepared. With that said, we will continue to monitor new data points and look for the exceptions, which may present interesting opportunities. But looking at the industry as a whole, it is hard to ignore the similarities – so for now the question remains: Why can’t software be the new shale?
DEFINITIONS
Generally accepted accounting principles (GAAP) are the standardized set of principles that public companies in the U.S. must follow.
Internal Rate of Return (IRR) is a metric used in financial analysis to estimate the profitability of potential investments. IRR is a discount rate that makes the net present value (NPV) of all cash flows equal to zero in a discounted cash flow analysis.
Earnings Before Interest, Taxes, Depreciation (or Depletion), Amortization, and Exploration Expense (EBITDAX) is an indicator of financial performance that is used when reporting earnings, specifically for oil and mineral exploration companies.
A “take-private” transaction means that a large private-equity group, or a consortium of private-equity firms, purchases or acquires the stock of a publicly traded corporation.
A restricted stock unit (RSU) is an award of stock shares, usually given as a form of employee compensation. The recipient must meet certain conditions before the restricted stock units are transferred to the owner.
End NOTE
1 Morgan Stanley – “Pioneer Natural Resources: Upgrading the Archetypal Shale Stock” – 7/13/15
IMPORTANT INFORMATION
The information provided in this document does not constitute investment advice and no investment decision should be made based on it. Neither the information contained in this document or in any accompanying oral presentation is a recommendation to follow any strategy or allocation. In addition, neither is a recommendation, offer or solicitation to sell or buy any security or to purchase of shares in any fund or establish any separately managed account. It should not be assumed that any investments made by GQG Partners LLC (GQG) in the future will be profitable or will equal the performance of any securities discussed herein. Before making any investment decision, you should seek expert, professional advice, including tax advice, and obtain information regarding the legal, fiscal, regulatory and foreign currency requirements for any investment according to the law of your home country, place of residence or current abode.
This document reflects the views of GQG as of a particular time. GQG’s views may change without notice. Any forward-looking statements or forecasts are based on assumptions and actual results may vary. GQG provides this information for informational purposes only. GQG has gathered the information in good faith from sources it believes to be reliable, including its own resources and third parties. However, GQG does not represent or warrant that any information, including, without limitation, any past performance results and any third-party information provided, is accurate, reliable or complete, and it should not be relied upon as such. GQG has not independently verified any information used or presented that is derived from third parties, which is subject to change. Information on holdings, allocations, and other characteristics is for illustrative purposes only and may not be representative of current or future investments or allocations.
Past performance may not be indicative of future results. Performance may vary substantially from year to year or even from month to month. The value of investments can go down as well as up. Future performance may be lower or higher than the performance presented and may include the possibility of loss of principal. It should not be assumed that investments made in the future will be profitable or will equal the performance of securities listed herein.
The information contained in this document is unaudited. It is published for the assistance of recipients, but is not to be relied upon as authoritative and is not to be substituted for the exercise of one’s own judgment. GQG is not required to update the information contained in these materials, unless otherwise required by applicable law. No portion of this document and/or its attachments may be reproduced, quoted or distributed without the prior written consent of GQG.
GQG is registered as an investment adviser with the U.S. Securities and Exchange Commission. Please see GQG’s Form ADV Part 2, which is available upon request, for more information about GQG.
Any account or fund advised by GQG involves significant risks and is appropriate only for those persons who can bear the economic risk of the complete loss of their investment. There is no assurance that any account or fund will achieve its investment objectives. Accounts and funds are subject to price volatility and the value of a portfolio will change as the prices of investments go up or down. Before investing in a strategy, you should consider the risks of the strategy as well as whether the strategy is appropriate based upon your investment objectives and risk tolerance.
There may be additional risks associated with international and emerging markets investing involving foreign, economic, political, monetary, and/or legal factors. International investing is not for everyone. You can lose money by investing in securities.
Where referenced, the title Partner for an employee of GQG Partners LLC indicates the individual’s leadership status within the organization. While Partners hold equity interests in GQG Partners Inc., as a legal matter they do not hold partnership interests in GQG Partners LLC or GQG Partners Inc.
GQG Partners LLC is a wholly owned subsidiary of GQG Partners Inc., a Delaware corporation that is listed on the Australian Securities Exchange.
NOTICE TO AUSTRALIA & NEW ZEALAND INVESTORS
The information in this document is issued and approved by GQG Partners LLC (“GQG”), a limited liability company and authorised representative of GQG Partners (Australia) Pty Ltd, ACN 626 132 572, AFSL number 515673. This information and our services may only be provided to retail and wholesale clients (as defined in section 761G of the Corporations Act 2001 (Cth)) domiciled in Australia. This document contains general information only, does not contain any personal advice and does not take into account any prospective investor’s objectives, financial situation or needs. In New Zealand, any offer of a Fund is limited to ‘wholesale investors’ within the meaning of clause 3(2) of Schedule 1 of the Financial Markets Conduct Act 2013. This information is not intended to be dis-tributed or passed on, directly or indirectly, to any other class of persons in Australia and New Zealand, or to persons outside of Australia and New Zealand.
NOTICE TO CANADIAN INVESTORS
This document has been prepared solely for information purposes and is not an offering memorandum nor any other kind of an offer to buy or sell or a solicitation of an offer to buy or sell any security, instrument or investment product or to participate in any particular trading strategy. It is not intended and should not be taken as any form of advertising, recommendation or investment advice. This information is confidential and for the use of the intended recipients only. The distribution of this document in Canada is restricted to recipients in certain Canadian jurisdictions who are eligible “permitted clients” for purposes of National Instrument 31-103 Registration Requirements, Exemptions and Ongoing Registrant Obligations.
NOTICE TO SOUTH AFRICAN INVESTORS
Investors should take cognisance of the fact that there are risks involved in buying or selling any financial product. Past performance of a financial product is not necessarily indicative of future performance. The value of financial products can increase as well as decrease over time, depending on the value of the underlying securities and market conditions. The investment value of a financial product is not guaranteed and any Illustrations, forecasts or hypothetical data are not guaranteed, these are provided for illustrative purposes only. This document does not constitute a solicitation, invitation or investment recommendation. Prior to selecting a financial product or fund it is recommended that South Africa based investors seek specialised financial, legal and tax advice. GQG PARTNERS LLC is a licensed financial services provider with the Financial Sector Conduct Authority (FSCA) of the Republic of South Africa, with FSP number 48881.
NOTICE TO UNITED KINGDOM INVESTORS
GQG Partners is not an authorised person for the purposes of the Financial Services and Markets Act 2000 of the United Kingdom (“FSMA”) and the distribution of this document in the United Kingdom is restricted by law. Accordingly, this document is provided only for and is directed only at persons in the United Kingdom reasonably believed to be of a kind to whom such promotions may be communicated by a person who is not an authorised person under FSMA pursuant to the FSMA (Financial Promotion) Order 2005 (the “FPO”). Such persons include: (a) persons having professional experience in matters relating to investments; and (b) high net worth bodies corporate, partnerships, unincorporated associations, trusts, etc. falling within Article 49 of the FPO. The services provided by GQG Partners and the investment opportunities described in this document are available only to such persons, and persons of any other description may not rely on the information in it. All, or most, of the rules made under the FSMA for the protection of retail clients will not apply, and compensation under the United Kingdom Financial Services Compensation Scheme will not be available.
GQG Partners (UK) Ltd. is a company registered in England and Wales, registered number 1175684. GQG Partners (UK) Ltd. is an appointed representative of Sapia Partners LLP, which is a firm authorised and regulated by the Financial Conduct Authority (“FCA”) (550103).
© 2023 GQG Partners LLC. All rights reserved. Data and content presented is as of November 30, 2022 and in US dollars (US$) unless otherwise stated.
TLFLI SFTWRSHL1222