Forward-Looking Quality

Show me what Forward-Looking Quality looks like in action
Forward-Looking Quality focuses on qualitative assessments of barrier to entry, earnings sustainability, and overall industry dynamics to direct our research process. The approach drives our investment team to identify companies we believe are capable of delivering durable earnings and future cash flow growth regardless of growth or value labels. In addition to the quality and sustainability of earnings growth, position size is also a critical dimension of our investment process. We believe success comes through active management and our ability to build positions in companies in which we have high conviction. Let’s take a look at two examples to bring the concept of Forward-Looking Quality to life.
CASE STUDY: MICROSOFT VERSUS EXXONMOBIL
It may be as much a mistake to assume that a company’s growth will continue indefinitely as it is to assume that it cannot be reinvigorated after a downturn, even one that lasts many years. These two companies have quite different business models, however, they both have persevered through several up and down cycles throughout their respective histories. The investment case for a stock can change quickly and could be due to either new management as with Microsoft or to a better operating environment such as is the case with Exxon. Let’s examine these two holdings and their respective historic weights in the portfolio.
UNCOVERING OPPORTUNITIES IN TECHNOLOGY
Satya Nadella took over the reins of Microsoft in 2014 and subsequently engineered what we view as one of the most impressive corporate turnarounds in history. The company appeared to be languishing in low growth business lines. Despite internal and external skepticism, Nadella was able to pivot the company into some of the fastest growing segments of the software industry. We believe the most notable example is Microsoft’s cloud business Azure, which generates a $60+ billion annual run rate revenue, rivaling Amazon’s AWS market leading cloud product.
Many growth investors seemed to hold on to the notion that the best days for Microsoft were in the past and it was too big and bureaucratic to change its stripes. However, by investigating forward-looking metrics rather than using backward-looking methods, we gained confidence that the company had shifted in the right direction.
Microsoft began building out capabilities in markets with enormous potential such as the cloud and office productivity. We believed the probability for success was high and the management team had the ability to execute on these large potential market opportunities. Rather than extrapolating what happened in the prior 15 years, we considered what the earnings could look like 3-5 years going forward if these initiatives were modestly successful.
Many sell-side analysts had difficulty predicting Microsoft’s earnings potential and in December of 2018 consensus estimates were that Microsoft would earn $5.85 per share in fiscal 2021. By the end of the following year, analyst’s estimates had increased to $6.05 per share. In 2022, the company reported actual normalized earnings per share of $8.05.
During this period, Microsoft became one the largest positions in the US Equity strategy. The stock appreciated rapidly as more analysts and market participants appeared to recognize the company’s potential.
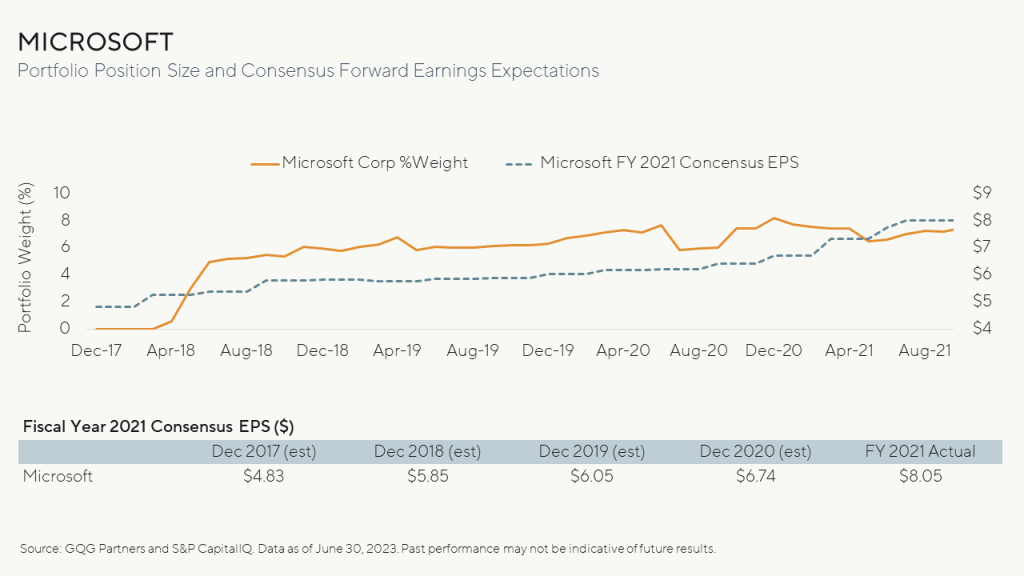
As with many software companies post-COVID, enthusiasm pushed the stock valuation past the point in which we believed fundamentals were supportive. In our opinion, it was becoming clear that some earnings had been pulled forward from future periods. In light of this, we began trimming back our position and allocating the capital towards new ideas such as ExxonMobil.
Learn More about GQG’s US Equity Strategy
FINDING OPPORTUNITY IN ENERGY
The collapse of energy prices in 2014 and 2015 left deep scars on the energy sector which lasted nearly half a decade. The industry already had a reputation for being poor stewards of capital, overinvesting in boom times, and underinvesting during the lean years. If this industry backdrop was not enough, the struggle to attract capital became even worse with the rapid growth of sustainable investment products which eschew traditional fossil fuel business models.
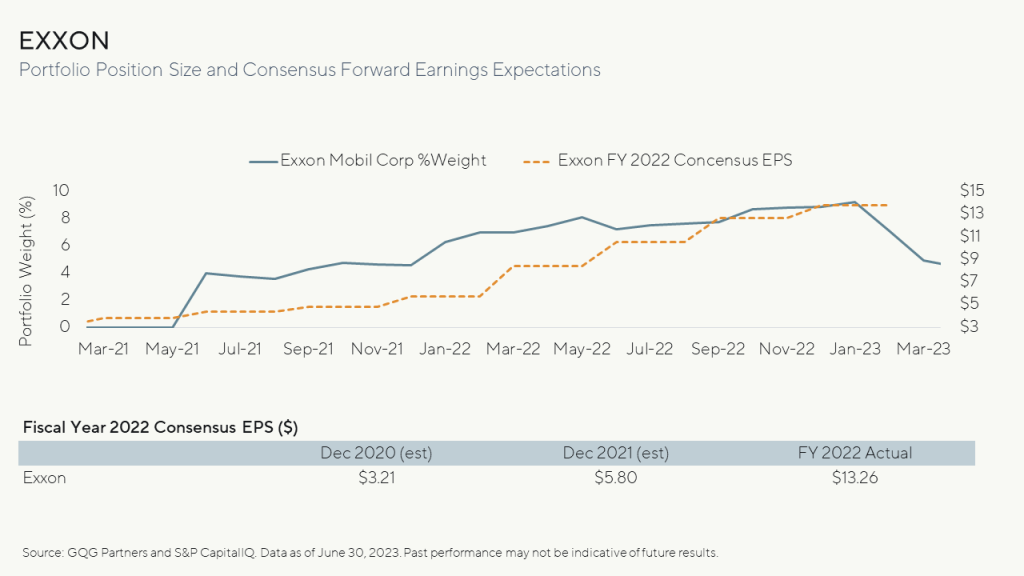
Many investors left the energy sector after oil prices nose-dived during the global COVID lockdowns. However, we believed there was a supply and demand imbalance in the underlying commodity markets and began building a thesis around our views and uncovering opportunities within the energy sector. Ultimately, we made an investment in ExxonMobil after applying our Forward-Looking Quality lens.
Exxon was not immune from the industry’s past reputation. However, we believe the company started to become more disciplined in their approach. Exxon re-oriented management compensation towards shareholder return metrics as opposed to unprofitable expansion – changing the bonus incentives for management from production to return on invested capital.
The company implemented a capital return program for their free cash flow favorable to shareholders such as share repurchases and dividends. This represented what we viewed as a radical philosophical change at the company and not that dissimilar to the one Microsoft experienced several years earlier. It seemed analysts found it difficult to predict the earnings power and cash flows for reimagined energy companies like Exxon even though it has been around for more than 100 years.
In December of 2020 the consensus EPS expectation for fiscal year 2022 was $3.21. One year later the expectation rose more than 80% to $5.80. In February, Exxon reported full year 2023 normalized EPS of $13.26, more than four times the original estimate.
We believe the world is moving toward a less carbon intensive future and are supportive of this transition. However, this transition will take many years in our opinion. Experts agree that in the meantime fossil fuels like natural gas, coal, and oil will be an important input for global economies for quite some time. High quality companies, such as ExxonMobil, that are focused on efficiently extracting and delivering much needed resources, represent what we believe to be attractive investment opportunities if one is willing to take a Forward-Looking approach.
The Value-Add of Forward-Looking Quality
Both ExxonMobil and Microsoft are compelling examples of how a non-consensus, Forward-Looking view can add significant value to portfolios. Stock market prices often represent viewpoints that we believe can lean more heavily on a company’s past rather than its potential. GQG builds portfolios with companies that we believe have more future potential . We believe our track record demonstrates the power of adaptability and a Forward-Looking approach to constructing portfolios. Our CIO Rajiv Jain says it best “We don’t anchor on the past, we go where the data takes us.”

While we believe the discussion of Microsoft and Exxon, for the time period referenced, demonstrates a favorable outcome resulting from GQG’s Forward-Looking Quality process, there may have been time periods when the performance of Microsoft or Exxon detracted from overall performance across GQG strategies. Additionally, there have been times when GQG’s Forward-looking Quality approach was not successful. There is no guarantee that the investments discussed herein were or will be profitable.
Seeking Consistent Performance Across Changing Marketing Conditions
GQG Partners US Equity Composite
|
TOTAL RETURNS
AS OF MAR 31, 2024 |
1 MO
|
3 MO
|
YTD
|
1 YR
|
3 YR
|
5 YR
|
SINCE
(01-JUL-2014) |
|---|---|---|---|---|---|---|---|
|
Composite (net fees) %
|
3.06
|
22.95
|
22.95
|
49.54
|
18.37
|
19.47
|
16.59
|
|
S&P 500 %
|
3.22
|
10.56
|
10.56
|
29.88
|
11.49 |
15.05
|
12.72
|
The Composite does not include any wrap fee paying clients for the periods shown and the net of fee performance does not reflect all fees that may be incurred by a wrap fee paying client. The net of fee Composite performance would be reduced by the impact of wrap fees paid.
GQG Partners LLC claims compliance with the Global Investment Performance Standards (GIPS®) and has prepared and presented this performance information in compliance with the GIPS standards. GIPS® is a registered trademark of CFA Institute. CFA Institute does not endorse or promote this organization, nor does it warrant the accuracy or quality of the content contained herein. GIPS composite reports may be obtained by emailing clientservices@gqg.com.
Performance data is based on the firm’s composite for the strategy. The composite was created in June 2016. Performance presented prior to June 1, 2016 was achieved prior to the creation of the firm. The prior track record has been reviewed by Ashland Partners & Company, LLP and conforms to the portability requirements of the GIPS standards. On June 28, 2017, ACA Performance Services, LLC acquired the investment performance service business of Ashland Partners & Company, LLP. For periods after June 1, 2016, the composites consist of accounts managed by GQG pursuant to the strategy.
The US dollar is the currency used to express performance. Returns are presented net of management fees and include the reinvestment of all income. Net performance is calculated after the deduction of actual trading expenses and other administrative fees (custody, legal, admin, audit and organization fees). Net returns are calculated using the highest/model rack rate fee. Net performance is net of foreign withholding taxes. Returns for periods greater than one year are annualized.
FOR FINANCIAL PROFRESSIONAL USE ONLY. NOT FOR DISTRIBUTION TO THE PUBLIC.
IMPORTANT INFORMATION
PAST PERFORMANCE MAY NOT BE INDICATIVE OF FUTURE RESULTS
GQG Partners LLC (“GQG”) is registered as an investment adviser with the U.S. Securities and Exchange Commission. Please see GQG’s Form ADV Part 2, which is available upon request, for more information about GQG.
The information provided on this website has not been audited; does not constitute investment advice; is not a recommendation to follow any strategy or allocation; should not be substituted for the exercise of one’s own judgement; and no investment decision should be made based upon it. In addition, neither is it a recommendation, offer, or solicitation to sell or buy any security or to purchase of shares in any fund or establish any separately managed account. It should not be assumed that any recommendations made by GQG will be profitable or will equal the performance of any securities discussed herein. This website reflects the views of GQG as of a particular time; these views may change without notice. Any forward-looking statements or forecasts are based upon assumptions and actual results may vary. GQG provides this website and its content for informational purposes only. While GQG has gathered the information in good faith from sources it deems to be reliable, GQG does not represent or warrant that any information, without limitation, is accurate, reliable, or complete, and it should not be relied upon as such.
Before making any investment decision, you should seek expert, professional advice, including tax advice, and obtain information regarding the legal, fiscal, regulatory, and foreign currency requirements for any investment according to the law of your home country, place of residence, or current abode.
Any account or fund advised by GQG involves significant risks and is appropriate only for those persons who can bear the economic risk of the complete loss of their investment. There is no assurance that any account or fund will achieve its investment objective. Accounts and funds are subject to price volatility and the value of a portfolio will change as the prices of investments go up or down. Before investing in any strategy, you should consider the risks of the strategy as well as whether the strategy is appropriate based upon your investment objective(s) and risk tolerance. There may be additional risks associated with international and emerging markets investing involving foreign, economic, political, monetary, and/or legal factors. International investing is not for everyone. You can lose money by investing in securities.
INFORMATION ABOUT REPRESENTATIVE ACCOUNTS
Portfolio characteristics, top ten holdings, sector allocation, country allocation, ROE and market capitalization are based on a representative portfolio, which is the account in the composite that GQG believes most closely reflects the current portfolio management style for this strategy. Performance is not a consideration in the selection of the representative portfolio. The information for the representative portfolio shown may differ from that of the composite, however, performance for the representative portfolio is generally not materially higher than the performance of the composite. The top ten holdings identified and described do not represent all securities purchased, sold, or considered for clients in the composite and no assumption should be made that such securities or future recommendations were or will be profitable in the future. Portfolio holdings are subject to change without notice. Country allocations shown reflect the country of risk of the securities in the portfolio as assigned by Northern Trust (NT), though GQG’s portfolios are constructed based on GQG’s assessment of each issuer’s country of risk exposure, which may not be the same as NT’s country assignment. GQG assesses the country’s economic fortunes and risks to which it believes the issuer’s assets, operations and revenues are most exposed by considering such factors as the issuer’s country of incorporation, actual physical location of its operations, the primary exchange on which its securities are traded and the country in which the greatest percentage of its revenue is generated.
INFORMATION ON RISK STATISTICS
Standard Deviation: Absolute volatility measured as the dispersion of monthly returns around an average. Alpha: Outperformance measured as risk-adjusted excess returns over the benchmark. Beta: Relative volatility measured as systematic risk relative to a benchmark.
Historical Success Rates calculate the percentage of rolling periods that have achieved positive excess returns versus a benchmark over a stated date range. For example, a 3-year rolling period with a 1-month shift would have 85 individual 3-year periods (each beginning one month after the last) over a 10-year range. If a strategy achieved positive excess returns in 60 of those 85 periods, it would have a historical success rate of 70.59% (60 divided by 85).
INFORMATION ABOUT BENCHMARKS
The S&P 500 Index is a float-adjusted market cap weighted equity index of stocks of 500 leading companies in the United States. The S&P 500 Index is a product of S&P Dow Jones Indices LLC, a division of S&P Global, or its affiliates (SPDJI) and has been licensed for use by GQG Partners LLC. Standard & Poor’s® and S&P® are registered trademarks of Standard & Poor’s Financial Services LLC, a division of S&P Global (S&P); Dow Jones® is a registered trademark of Dow Jones Trademark Holdings LLC (Dow Jones). GQG Partners LLC is not sponsored, endorsed, sold or promoted by SPDJI, Dow Jones, S&P, their respective affiliates, and none of such parties make any representation regarding the advisability of investing in such product(s) nor do they have any liability for any errors, omissions, or interruptions of the S&P 500 Index.
Information about benchmark indices is provided to allow you to compare it to the performance of GQG strategies. Investors often use these well-known and widely recognized indices as one way to gauge the investment performance of an investment manager’s strategy compared to investment sectors that correspond to the strategy. However, GQG’s investment strategies are actively managed and not intended to replicate the performance of the indices: the performance and volatility of GQG’s investment strategies may differ materially from the performance and volatility of their benchmark indices, and their holdings will differ significantly from the securities that comprise the indices. You cannot invest directly in indices, which do not take into account trading commissions and costs. Net total return indices reinvest dividends after the deduction of withholding taxes, using (for international indices) a tax rate applicable to non-resident institutional investors who do not benefit from double taxation treaties.
INFORMATION ON PEER GROUP
The US Large Cap peer group is comprised of Morningstar accounts invested primarily in large cap and US companies. Stocks in the top 70% of the capitalization of the US equity market are defined as large cap.
Where referenced, the title Partner for an employee of GQG Partners LLC indicates the individual’s leadership status within the organization. While Partners hold equity interests in GQG Partners Inc., as a legal matter they do not hold partnership interests in GQG Partners LLC or GQG Partners Inc.
GQG Partners LLC is a wholly owned subsidiary of GQG Partners Inc., a Delaware corporation that is listed on the Australian Securities Exchange.
© 2024 GQG Partners. All Rights Reserved.