
Key Takeaways
Despite market volatility, opportunities have been identified in sectors such as energy and technology, with portfolio adjustments made to capitalize on these areas
In emerging markets, India and Brazil are viewed as having strong fundamentals and potential for future growth, despite market challenges and regulatory uncertainties
An underweight position has been maintained in China due to regulatory burdens, slowing growth, and declining fundamentals, indicating more durable earnings streams can be found elsewhere
While we remain sanguine on our overweight to the energy sector, we have trimmed exposure to certain names in that area in favor of opportunities across the technology landscape.
To review, the allocation to technology in our global portfolio exceeded 30 per cent during 2020 but fell into the single digits in 2022. We felt valuations became far too expensive and were skeptical that many companies could sustain what we considered to be elevated rates of earnings growth from the pull- forward of demand during the transition to work-from-home during the COVID-19 related lockdowns.
However, valuations for several technology franchises have since declined. In addition, we believe the “overearning” that occurred during the pandemic re-based to more realistic levels and earnings expectations normalized to pre-COVID trends. As a result, we increased our exposure to the technology sector during 1Q 2023.
We remain underweight China, given the regulatory uncertainty and slowing secular growth for many of the household names, while identifying what we think are more durable earnings streams in Brazil and India. The new presidential administration in Brazil recently announced a sensible budget, in our opinion, with expectations of a mild surplus in 2024 that should address investor concerns of potential profligate spending. We acquired stakes in four listed subsidiaries of India based industrial conglomerate Adani Group. We had been following these companies for several years, and found the underlying assets attractive, but the stocks were historically too richly valued for our liking. A short-seller report in January 2023 catalyzed a significant price decline in those Adani subsidiaries and presented an opportunity on which we acted in March.
We will continue to apply our investment process of focusing on Forward-Looking quality and remain open minded in finding opportunities to compound capital, wherever in the world we may find them.
The most difficult subjects can be explained to the most slow-witted man if he has not formed any idea of them already; but the simplest thing cannot be made clear to the most intelligent man if he is firmly persuaded that he knows already, without a shadow of doubt, what is laid before him. ”
— Leo Tolstoy1
It does not seem all that long ago, but it turns out that nearly two years ago, our 1Q 2021 commentary was titled “Quality on Sale”. Back then, we highlighted the interesting phenomenon that new opportunities were available allowing us to acquire quality franchises at very sensible prices. In fact, one of the measures we highlighted was that one could assemble a portfolio of stocks where the return on equity ratios were above the index while price-earnings ratios were below it. We felt this to be particularly noteworthy because it is not something that happens very often.
Fast forward to today and we are seeing something similar, but with a twist. In early 2021, areas of opportunity were in sectors like energy, where our view was that the industry backdrop was stable, asset bases were streamlined, and management teams were forced to become far more rational. And while we believe recency bias can be a systemic risk, we felt that many of these companies were being given away and the market meaningfully mispriced the opportunity set. Broadly, we happened to get that one correct (which certainly is not always the case). However, as we roll through 2023, we are now seeing positive changes in other sectors, and while we remain quite sanguine on the energy thesis, opportunities across the technology landscape have now become increasingly more abundant. More on that in a bit.
TURN UP THE (VOL)UME
If we think about our view on Forward-Looking quality and focus on our version of growth through the lens of compounding, things can get quite divergent indeed. Because we are not constrained by the 3×5 card of style box opinion, something we have highlighted many times in the past, we are free to follow compound earnings potential wherever that may exist. But as we noted above, simply having breadth within the opportunity set does not mean we will always get things right. In fact, as we review this past quarter’s performance, we were quite disappointed even though it is typically an environment where we would tend to lag.
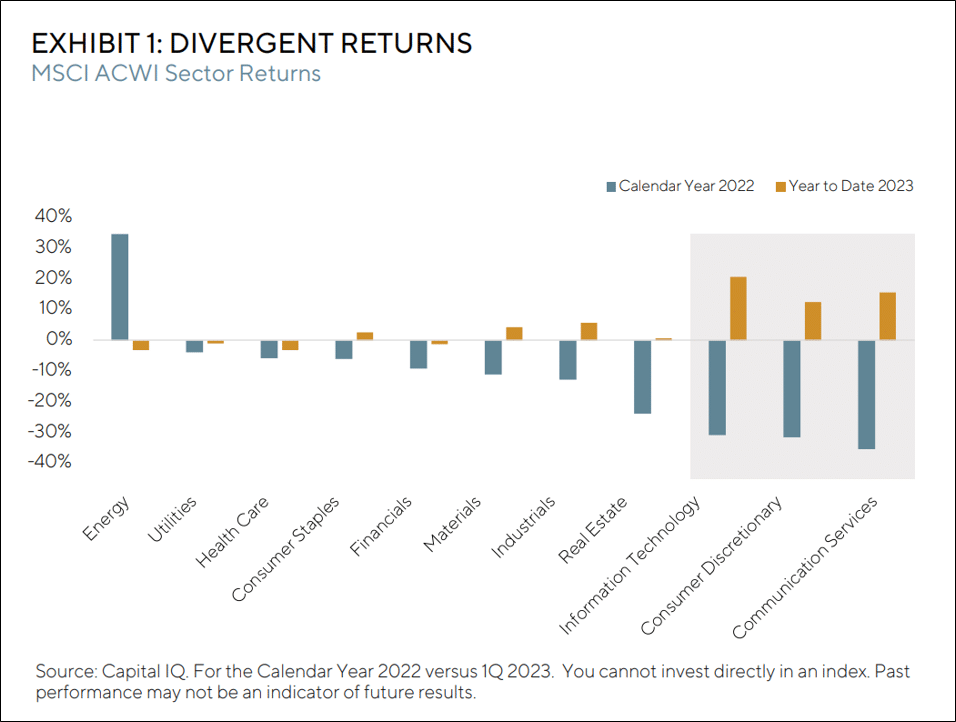
On a global basis, the quarter’s underperformance was most acute within the US and global portfolios, given the underlying return dynamics of the US centric opportunity set. For example, many of last year’s winners, sectors like health care and energy, underperformed, while last year’s laggards, areas like technology, consumer discretionary, and communication services, saw quite dramatic performance reversals as shown in Exhibit 1.
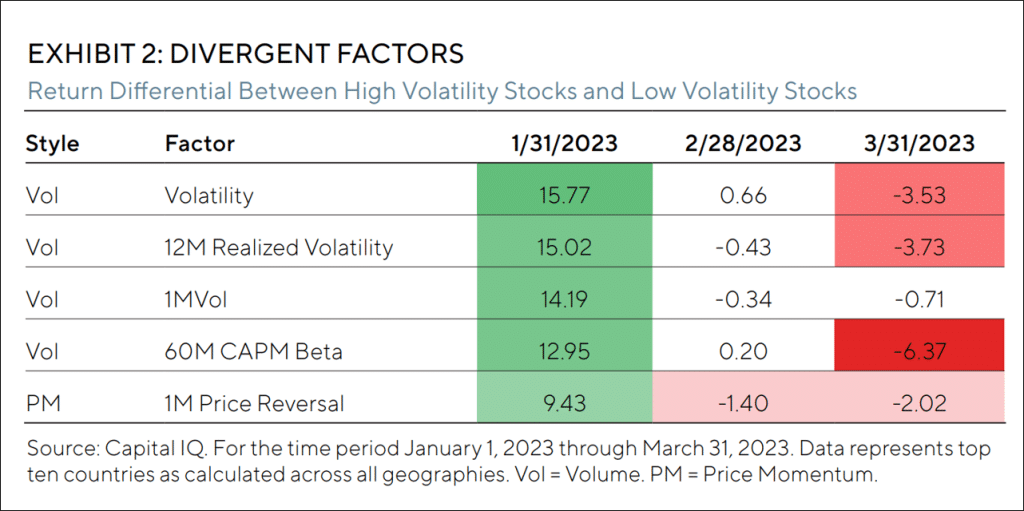
If we drill down further, we can see that most of the underperformance came during January and from a factor perspective, was driven predominately by high volatility, as shown in Exhibit 2. On a factor basis, Exhibit 2 is simply highlighting the return differential between the quintile of stocks with the highest exposure to volatility minus the quintile of stocks with the lowest exposure to volatility. From the exhibit, we can see that the January skew was quite wide and while the other two months of 2023 saw some give back, it was not nearly enough to offset how dramatic the move was in January.
Now, what we are not trying to do here is make excuses, because quite frankly, those are not terribly helpful. But what we are trying to do is put a relatively short time period (one quarter) into context. If we think back to our Tolstoy quote, we are not so deluded into thinking that we already know what lays before us. It is why we often get things wrong. However, we do pride ourselves on following the data and adapting to change, and this is what brings us to the interesting divergences that the volatility has created, starting with technology.
HISTORY DID NOT START YESTERDAY (AND WHY WE ARE OVERWEIGHT US TECHNOLOGY)
In our 4Q 2022 CIO Perspectives letter, we presented data from January 2020 through December 2022 comparing a basket of non-dividend and non-GAAP earnings per share (EPS) companies to a “mom and apple pie” cohort that paid dividends and delivered positive GAAP EPS. Over this time period, we saw the unprofitable basket perform spectacularly during 2020 and much of 2021, but ultimately give back all of its relative gains versus the much more tortoise-like, mom and apple pie stocks. Furthermore, we know that over the same time period, valuations for many companies in not only the unprofitable areas specifically, but the “COVID winners” more generally, became far too expensive given the visibility of growth that we thought these companies could deliver. Of course, from a global portfolio perspective, that is why our exposure to technology exceeded 30 per cent during 2020 but fell into the single digits in 2022.
Today, however, things are a bit different in our view. For starters, several of the franchises that became too expensive have seen their valuations fall back to levels that we believe are commensurate with their durability of growth. There is also an interesting divergence occurring within the technology sector, where profitable technology companies are now de-coupling from unprofitable ones in cumulative return space. We have highlighted this phenomenon in Exhibit 3.
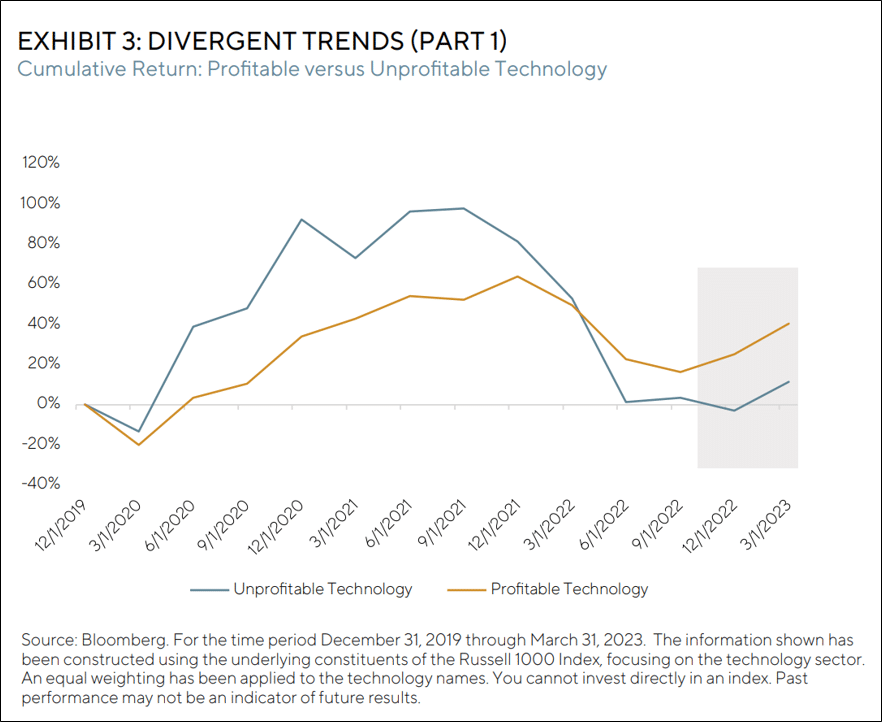
We think this is rather important to point out, because if we go back to most of the 2020-2022 time period, both the profitable and unprofitable groups traded in tandem, but to different degrees. Obviously, we can see that the unprofitable group went up more and fell more than the more profitable one, but as we approached the end of 2022, the profitable group started breaking away and this divergence accelerated throughout 1Q of 2023. For us, this is an encouraging sign, because it highlights one of our views coming into the year that while 2022 was dominated by P, or price, that 2023 would be dominated by E, or earnings. Because we believe that earnings are like gravity, this should be a more durable driver of stock price performance over time, rather than changes in sentiment.
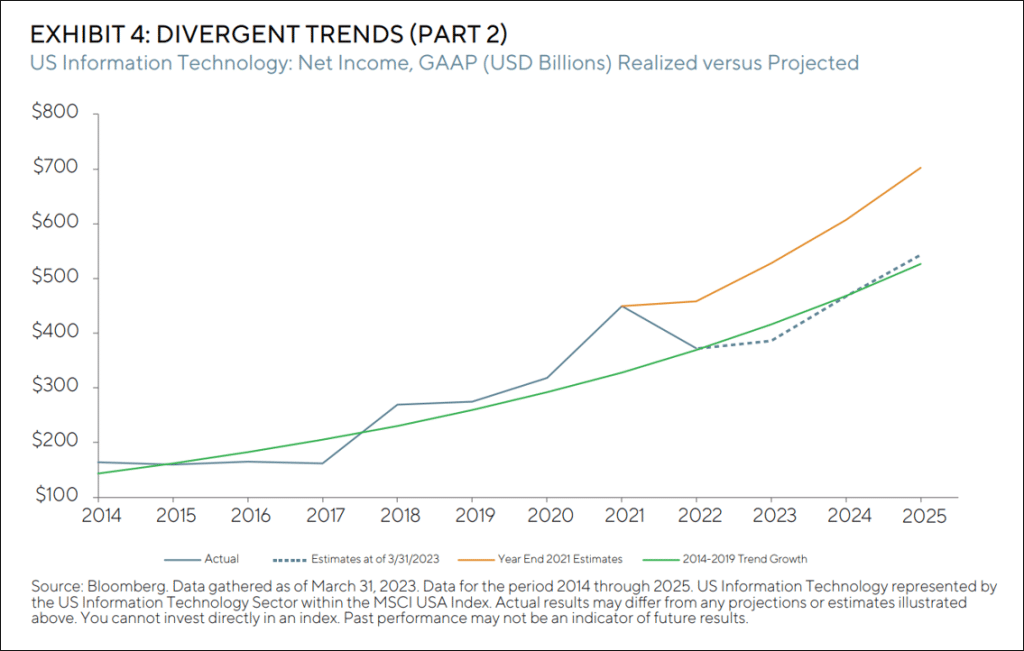
Lastly, on the “overearnings” front, which is something we have been concerned with in the technology sector and discussing for many months now, the froth appears to be taken out. When we look at Exhibit 4, we can see that unlike consensus estimates for 2022, consensus estimates for 2023 have reverted back to the pre-COVID, 2014-2019 extrapolated trend, representing a far more normalized environment in our view than what we saw in the immediate past.
As is often our refrain, when things change, we change. We always want to remain disciplined but avoid being overly dogmatic. Thanks to a variety of events that transpired across the quarter, these changes were in abundance, and we will address a few of the non-US ones below.
BRICS IN THE WALL
It is always important to remember that all of our portfolios are built on a bottom-up basis. Having said that, we remain quite macro aware because economic, and therefore geo-political developments, can be important risk factors when thinking about the earnings landscape.
Since February 2022 through the end of 1Q 2023, with the escalation of the war in Ukraine, many unintended consequences have transpired. We have seen large currency swings, with several Emerging Markets currencies performing quite well relative to the US dollar over this time period. The Mexican peso is one such non-obvious example. We have also seen an increase in the discussions on regionalization, particularly on the currency front, whether that is Brazil and Argentina2 discussing a common currency, or the BRICs more broadly.3 As presented from the perspective of the west, these developments are almost universally framed negatively.
We do not really have a view per se, because the current monetary regime that has prevailed for many decades has pluses and minuses depending on your vantage point. What we do have a view on, however, is that applying western standards, generally US and EU ones, to Emerging Markets, does not make a lot of sense to us. Whether that is the trend toward de-dollarization, which is clearly underway but will not change overnight, or it is the view that accounting standards, cultural norms, etc. should uniformly take a western lens, we find there is opportunity in the ambiguity (and by ambiguity we mean disagreement).
During the quarter, we were in the news for acquiring stakes in four listed subsidiaries of India-based industrial conglomerate Adani Group. What we found to be rather interesting about the increase in press, as it relates to our subheading earlier in this note: history did not start yesterday. We have actually been following these companies for several years, and while we found the underlying assets quite attractive, the stocks traded at valuations we considered to be too expensive. Additionally, when we make a decision to acquire a minority shareholder interest in any company, we never set out to lose capital. Whether that makes the news or it does not, the principle remains the same.
Perhaps even more interesting, is that the louder the press, the more overlooked the fundamental concepts seemed to be. Markets are dynamic, and interestingly, because different participants constantly reach different conclusions in regard to the value of companies and the price of things. However, even if our judgement turns out to be incorrect, we must not forget that no exchange would occur if we all agreed on everything. In fact, exchange only happens precisely because we disagree on the price of things, that is how capitalism works. In our view, a significant price decline in certain Adani subsidiaries presented an opportunity, so we acted. No more, no less and that is why our India exposure ticked up during the quarter.
In keeping with our BRICs discussion, let’s take a quick look at Brazil. We continue to remain positive on a variety of Brazilian companies from oil and gas to iron ore and banking. Despite this, the more recent ride has been anything but smooth, as noted by the heartburn incurred from equity market returns since October 2022. But if we take a look at the Brazilian government, a source of much consternation within the investment community, we do not really see what the big issue is.
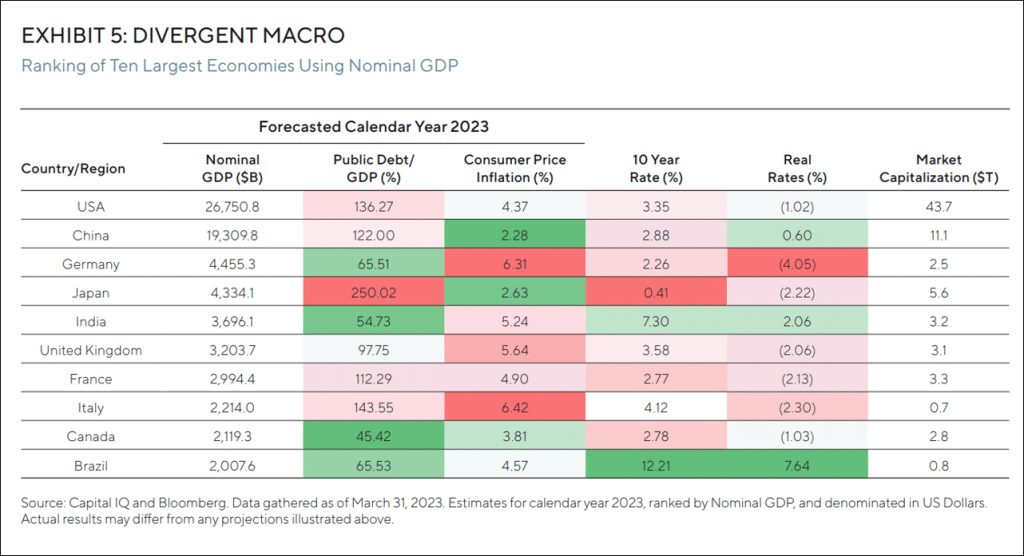
In fact, if we look at Exhibit 5, both India and Brazil appear to be in much better shape than many developed market countries. When ranking the 10 largest economies on the planet, using nominal GDP, we see that both India and Brazil have positive real interest rates, positive real GDP growth, and positive real fixed investment, all while keeping public debt to GDP relatively low.
Beyond this, in Brazil, the Lula administration recently announced a framework for keeping the budget in check in fiscal year 2024 (no deficit) with expectations of a mild budget surplus in 2025.4 This is the opposite of the initial fears of what spending from a Lula regime would look like. And remember, this is from a left-leaning administration (an observable fact not political commentary). Contrast this with that of the United States, which also has a left-leaning administration, but apparently very few fears over fiscal spending, where the Congressional Budget Office is projecting a budget deficit of nearly six per cent of GDP in 2024 and beyond.5 This also coincides with strong privatization efforts in both Brazil and India, while Europe is nationalizing utilities and the US kicks around the idea of windfall profits. So much for Emerging Market countries being overly protectionist and far more profligate than Developed Market ones when it comes to fiscal spend.
Lastly, we would be remiss if we did not address the C in BRICs (the R not withstanding). For us, not much has changed in China as what relative exposure we do have remains in the “old economy” areas such as oil and gas as well as insurance. Given the high degree of uncertainty on the policy front, where China is actually breaking from its BRICs peers and is increasing government regulation, we remain underweight. Combine this regulatory burden with slowing growth and declining fundamentals for a variety of the more household names, and this underscores our view that more durable earnings streams exist elsewhere despite the recently announced breakups of several high-profile companies in order to “unlock value”.6
With all of this in mind, we acknowledge that divergences on a global scale are always tricky to navigate. However, we must agree with Tolstoy in that being wholly convinced of the way things will ultimately play out is highly problematic. We remain open-minded in finding opportunities to compound capital, wherever in the world we may find them.
As always, thank you for your continued support.
Rajiv Jain
Chairman & Chief Investment Officer
GQG Partners LLC
DEFINITIONS
Return on equity (ROE) is the measure of a company’s net income divided by its shareholders’ equity.
The price-to-earnings (P/E) ratio is the ratio for valuing a company that measures its current share price relative to its earnings per share (EPS).
Earnings per share (EPS) is the monetary value of earnings per outstanding share of common stock for a company.
END NOTES
1Tolstoy, Count Leo, The Kingdom of God is Within You (New York, New York: The Cassell Publishing Co., 1984), p. 49.
2Shekhar, Prof. Vidhu, “Petro-Yuan or Petro-BRICS: The need for better alternative reserve currencies to break dollar dominance,” India Forbes, March 30, 2023.
https://www.forbesindia.com/article/bharatiya-vidya-bhavan039s-spjimr/petroyuan-or-petrobrics-the-need-for-better-alternative-reserve-currencies-to-break-dollar-dominance/84063/1
3Steinberg, Federico and Otero-Iglesias, Miguel, “South America’s ‘Common Currency’ Is Actually about De-dollarization,” Center for Strategic & International Studies, February 14, 2023.
https://www.csis.org/analysis/south-americas-common-currency-actually-about-de-dollarization
4“Brazil’s new fiscal rules include the poorest in the government budget and foresee a surplus for 2025,” gov.br ,March 30, 2023.
https://www.gov.br/planalto/en/latest-news/brazil2019s-new-fiscal-rules-include-the-poorest-in-the-government-budget-and-foresee-a-surplus-for-2025
5”Budget and Economic Data”, Congressional Budget Office, Nonpartisan Analysis for the U.S. Congress,
https://www.cbo.gov/data/budget-economic-data
6Denton, Jack, “JD.com Follows Alibaba’s Lead With Plans to Spin Off Units,” Barron’s, March 31, 2023.
https://www.barrons.com/articles/jd-com-stock-spinoff-alibaba-701235ba
IMPORTANT INFORMATION
MSCI benchmark returns have been obtained from MSCI, a non-affiliated third-party source. Neither MSCI nor any other party involved in or related to compiling, computing or creating the MSCI data makes any express or implied warranties or representations with respect to such data (or the results to be obtained by the use thereof), and all such parties hereby expressly disclaim all warranties of originality, accuracy, completeness, merchantability or fitness for a particular purpose with respect to any of such data. Without limiting the foregoing, in no event shall MSCI, any of its affiliates or any third party involved in or related to compiling, computing, or creating the data have any liability for any direct, indirect, special, punitive, consequential or any other damages (including lost profits) even if notified of the possibility of such damages.
Net total return indices reinvest dividends after the deduction of withholding taxes, using (for international indices) a tax rate applicable to nonresident institutional investors who do not benefit from double taxation treaties.
Information about benchmark indices is provided to allow you to compare it to the performance of GQG strategies. Investors often use these well-known and widely recognized indices as one way to gauge the investment performance of an investment manager’s strategy compared to investment sectors that correspond to the strategy. However, GQG’s investment strategies are actively managed and not intended to replicate the performance of the indices: the performance and volatility of GQG’s investment strategies may differ materially from the performance and volatility of their benchmark indices, and their holdings will differ significantly from the securities that comprise the indices. You cannot invest directly in indices, which do not take into account trading commissions and costs.
The Russell 1000 Index is a subset of the Russell 3000 Index that includes approximately 1,000 of the largest companies in the US equity universe. Constructed using a transparent, rules-based methodology, the Russell 1000 Index is designed to provide unbiased representation of the large cap segment of the US equity market.
The MSCI USA Index is designed to measure the performance of the large and mid cap segments of the US market. With 622 constituents, the index covers approximately 85% of the free float-adjusted market capitalization in the US.
The MSCI All Country World Index (MSCI ACWI) captures large and mid cap representation across 23 Developed Markets (DM) and 24 Emerging Markets (EM) countries. With 2,888 constituents, the index covers approximately 85% of the global investable equity opportunity set. DM countries include Australia, Austria, Belgium, Canada, Denmark, Finland, France, Germany, Hong Kong, Ireland, Israel, Italy, Japan, Netherlands, New Zealand, Norway, Portugal, Singapore, Spain, Sweden, Switzerland, the UK and the US. EM countries include: Brazil, Chile, China, Colombia, Czech Republic, Egypt, Greece, Hungary, India, Indonesia, Korea, Kuwait, Malaysia, Mexico, Peru, Philippines, Poland, Qatar, Saudi Arabia, South Africa, Taiwan, Thailand, Turkey and United Arab Emirates.
NOTICE TO AUSTRALIA & NEW ZEALAND INVESTORS
The information in this document is issued and approved by GQG Partners LLC (“GQG”), a limited liability company and authorised representative of GQG Partners (Australia) Pty Ltd, ACN 626 132 572, AFSL number 515673. This information and our services may only be provided to retail and wholesale clients (as defined in section 761G of the Corporations Act 2001 (Cth)) domiciled in Australia. This document contains general information only, does not contain any personal advice and does not take into account any prospective investor’s objectives, financial situation or needs. In New Zealand, any offer of a Fund is limited to ‘wholesale and retail investors’ within the meaning of clause 3(2) of Schedule 1 of the Financial Markets Conduct Act 2013. This information is not intended to be distributed or passed on, directly or indirectly, to any other class of persons in Australia and New Zealand, or to persons outside of Australia and New Zealand.
NOTICE TO CANADIAN INVESTORS
This document has been prepared solely for information purposes and is not an offering memorandum nor any other kind of an offer to buy or sell or a solicitation of an offer to buy or sell any security, instrument or investment product or to participate in any particular trading strategy. It is not intended and should not be taken as any form of advertising, recommendation or investment advice. This information is confidential and for the use of the intended recipients only. The distribution of this document in Canada is restricted to recipients in certain Canadian jurisdictions who are eligible “permitted clients” for purposes of National Instrument 31-103 Registration Requirements, Exemptions and Ongoing Registrant Obligations.
NOTICE TO SOUTH AFRICAN INVESTORS
Investors should take cognisance of the fact that there are risks involved in buying or selling any financial product. Past performance of a financial product is not necessarily indicative of future performance. The value of financial products can increase as well as decrease over time, depending on the value of the underlying securities and market conditions. The investment value of a financial product is not guaranteed and any Illustrations, forecasts or hypothetical data are not guaranteed, these are provided for illustrative purposes only. This document does not constitute a solicitation, invitation or investment recommendation. Prior to selecting a financial product or fund it is recommended that South Africa based investors seek specialised financial, legal and tax advice. GQG PARTNERS LLC is a licenced financial services provider with the Financial Sector Conduct Authority (FSCA) of the Republic of South Africa, with FSP number 48881.
NOTICE TO UNITED KINGDOM INVESTORS
GQG Partners LLC is not an authorised person for the purposes of the Financial Services and Markets Act 2000 of the United Kingdom (“FSMA”) and the distribution of this document in the United Kingdom is restricted by law. Accordingly, this document is provided only for and is directed only at persons in the United Kingdom reasonably believed to be of a kind to whom such promotions may be communicated by a person who is not an authorised person under FSMA pursuant to the FSMA (Financial Promotion) Order 2005 (the “FPO”). Such persons include: (a) persons having professional experience in matters relating to investments; and (b) high net worth bodies corporate, partnerships, unincorporated associations, trusts, etc. falling within Article 49 of the FPO. The services provided by GQG Partners LLC and the investment opportunities described in this document are available only to such persons, and persons of any other description may not rely on the information in it. All, or most, of the rules made under the FSMA for the protection of retail clients will not apply, and compensation under the United Kingdom Financial Services Compensation Scheme will not be available.
GQG Partners LLC (UK) Ltd. is a company registered in England and Wales, registered number 1175684. GQG Partners LLC (UK) Ltd. is an appointed representative of Sapia Partners LLP, which is a firm authorised and regulated by the Financial Conduct Authority (“FCA”) (550103).
© 2023 GQG Partners LLC. All rights reserved. Data presented as at 30 September 2023 and denominated in US dollars (US$) unless otherwise indicated.
CIOLTR 3Q23