
Key Takeaways
2023 was a reversal of 2022, as strategies that led two years ago lagged last year and vice versa, yet over the full two-year period, our Global, International, Emerging Markets, and US strategies exhibited strong returns
Some key drivers of our relative performance were exposure to companies expected to benefit from advances in generative AI as well as strategic investments in the publicly listed subsidiaries of India’s Adani Group
In Emerging Markets, we continue to be underweight companies domiciled in China in favor of what we consider to be more compelling risk-adjusted opportunities in India and Brazil
2023 turned out to be a mirror image of 2022. Our principal strategies that had done well in 2022 struggled in 2023 and vice versa. However, if composite performance is examined on a consolidated basis over the last two calendar years, all of our strategies delivered strong cumulative net returns—Global up over 14 per cent, International up more than 8 per cent, US up more than 14 per cent, and Emerging Markets up over 3 per cent, as seen in the table at the bottom. The relative underperformance in the Global and US strategies was driven by our decision to maintain overweights to the energy and healthcare sectors, and an underweight to information technology, as we exited 2022 and entered 2023. While technology names exhibited a strong rally as soon as the calendar turned, energy lagged due to the slower than expected recovery in China while certain healthcare names were held back by concerns of rising medical costs due to a normalization of elective surgeries post-COVID and the expected popularity and expense of anti-obesity drugs.
The turnarounds in our strategies were driven by broad market changes. We believe 2022 was about the world discovering that fossil fuels are still much needed, zero interest rates are not sustainable, GAAP profits actually do matter, and the excess tech demand driven by the COVID environment could not last forever. 2023, however, was much more about the tech sector emerging out of the COVID hangover, aided by generative AI technologies becoming more tangible, further compounded at the end of the year by the increasing possibilities of central bank rate cuts.
If one’s valuations have changed, unremitting faithfulness to the once espoused principles of action merely for the sake of constancy would not be rational but simply stubborn…If the valuations change, acting must change also. Faithfulness, under changed conditions, to an old plan would be nonsensical…. Acting must be suited to purpose, and purposefulness requires adjustment to changing conditions.”
—Ludwig von Mises1
Having said that, while we’re never satisfied with underperformance across any time period, we’re, of course, aware that this business is won and lost through time, and we remain quite proud that longer-term outperformance is firmly intact.
Now, in keeping one eye on reflection and one eye on the future, we’ll discuss a couple of crucial investment outcomes that occurred during the past year and highlight one new one that may unfold as we progress through 2024 and beyond.
India Ignites
We often talk about changing our views when the data changes, and it’s hard to come up with an example that encapsulates this more so than our investment across a variety of Adani Group companies held in our Emerging Markets, International, Global, Global Dividend Income, and International Dividend Income strategies in 2023. We also think that making those investments was very much reflective of our quote above, where consistency in the face of change is more stubborn than virtuous. In our opinion, large dislocations create large opportunities. We saw this in 2022 when contrasting opportunities in technology versus energy globally, and in 2023, we saw this post the large drawdown across the Adani complex in early 2023.
We previously passed on investing in some of the Adani companies in prior years, not because of anything we deemed nefarious but because we thought the valuations were too rich for the growth opportunities or the prospects of the broader opportunity set at that time. It’s hard to stress that enough because things often do not change in a vacuum. However, there was a massive decline in price earlier in the year. Given our familiarity with the businesses, we were able to act quickly. Our traditional and non-traditional analysts conducted thorough work, leading us to the decision. We realized that our understanding of the businesses was at odds with the headlines. We recognized that the decline in price represented an opportunity.
Despite the ongoing negative headlines, our various investments across the Adani companies have been among our most profitable outcomes for clients that had exposure, generating nearly $4 billion in gains in aggregate across these strategies. To be clear, we are not patting ourselves on the back, but I think the examples we highlighted in this letter show our dynamic approach to investing, where we believe it is crucial to adapt and act quickly after doing an independent assessment of the facts—even when that means going against consensus or the general narrative. It is uncomfortable living this way, and we don’t always get it right, as I always like to remind folks that I’ve found plenty of ways of losing money over the years, regardless of our overall level of AUM (but I did learn some valuable lessons along the way!).
January Showers…
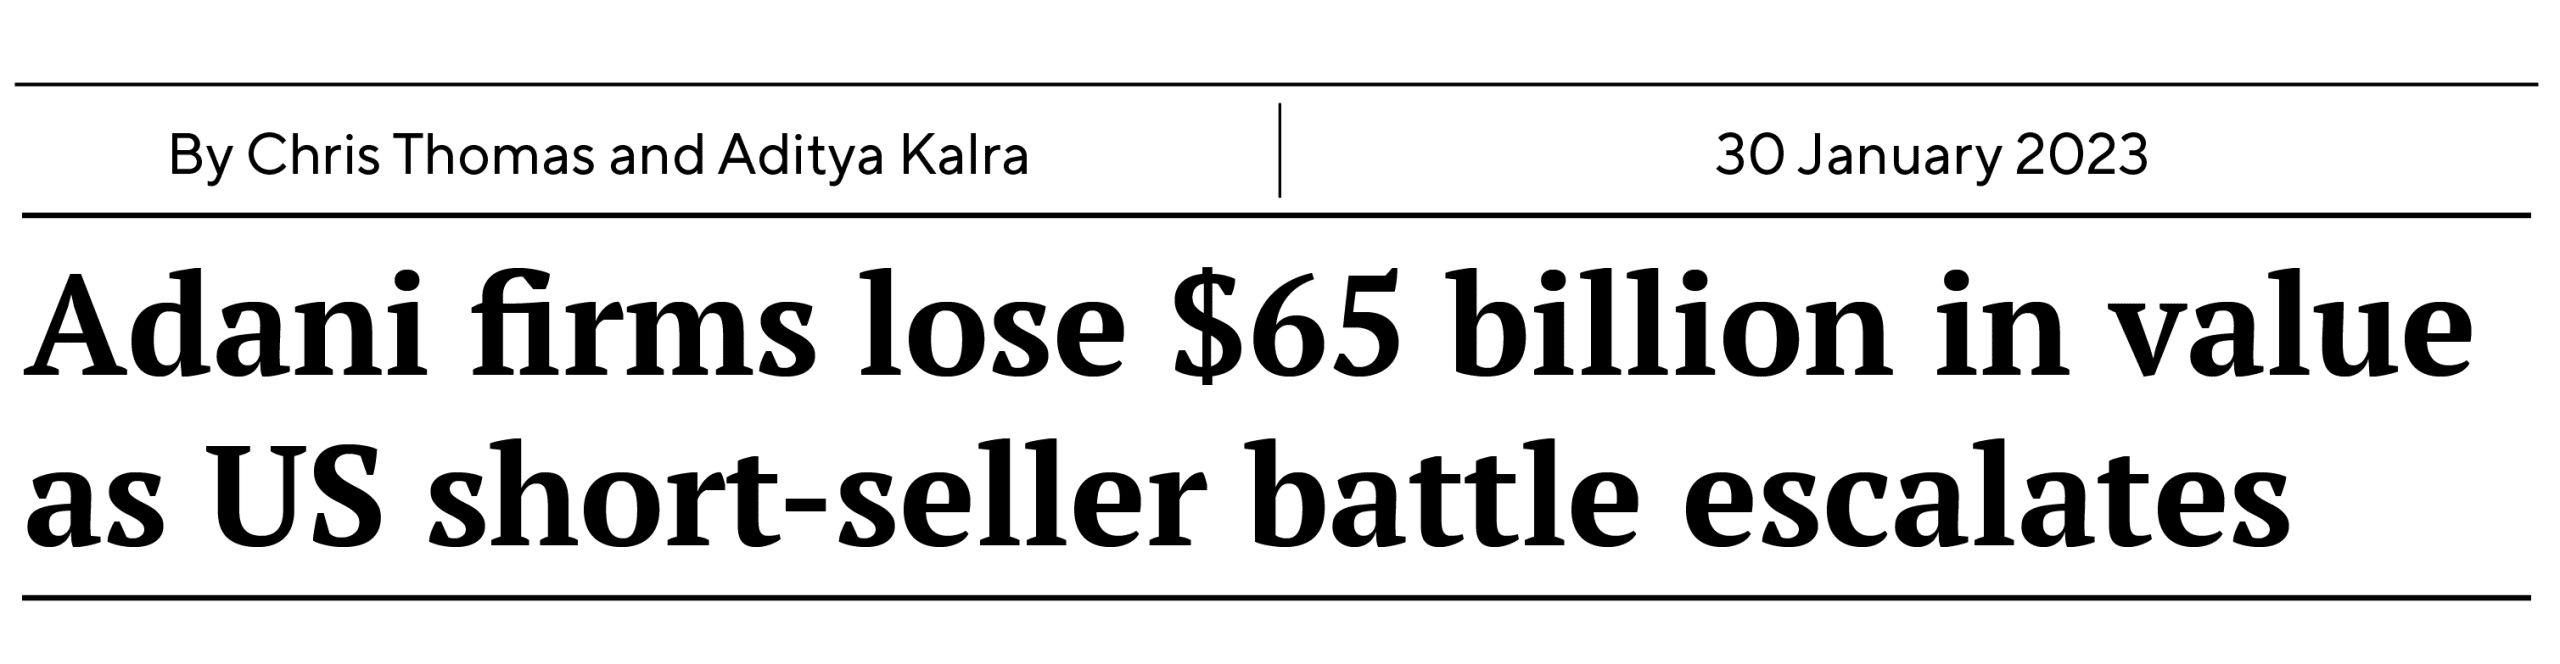
Source: Reuters, January 30, 2023, Adani firms lose $65 billion in value as U.S. short-seller battle escalates
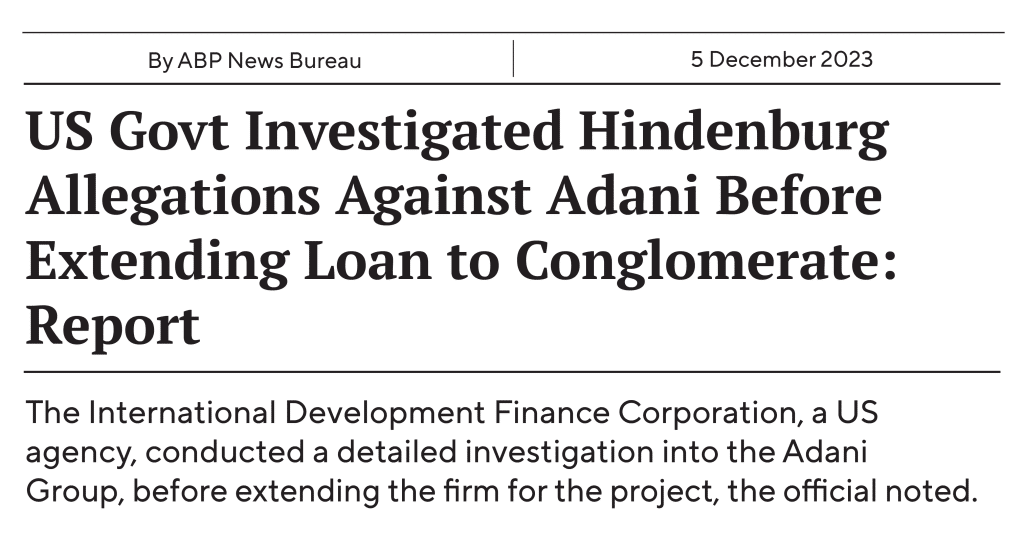
But in the case of Adani, the more we assessed the data and the more research we did, it became rather obvious to us that if we tuned out all the noise, these appeared to be impressive assets to invest in—run by what we think is one of the most dynamic and competent management teams anywhere in the world! Thus, we sized our Adani exposure in a thoughtful manner in the strategies that held it to help ensure the positions could make a meaningful difference to our returns for the disconnect we found. It may be worth noting that many of the accusations and issues in question appeared to be more politically motivated rather than focused on the fundamental drivers of the businesses’ future earnings and in our view this was the case, relative to the market price. It is important to highlight that various governments around the world partnered with Adani on key projects, including the US government, which recently invested more than $500 million in Adani’s Sri Lanka port after examining and dismissing the claims, as noted in the below headlines. In our view, the disconnect between the narrative and reality, based on fundamental analysis often creates rather attractive investment opportunities for us—energy and Adani are two big examples. We promise to keep looking.
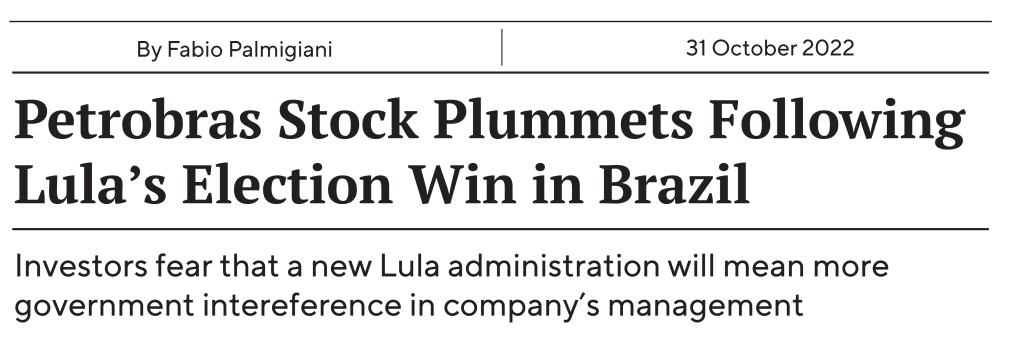
…Eventually Bring Flowers?

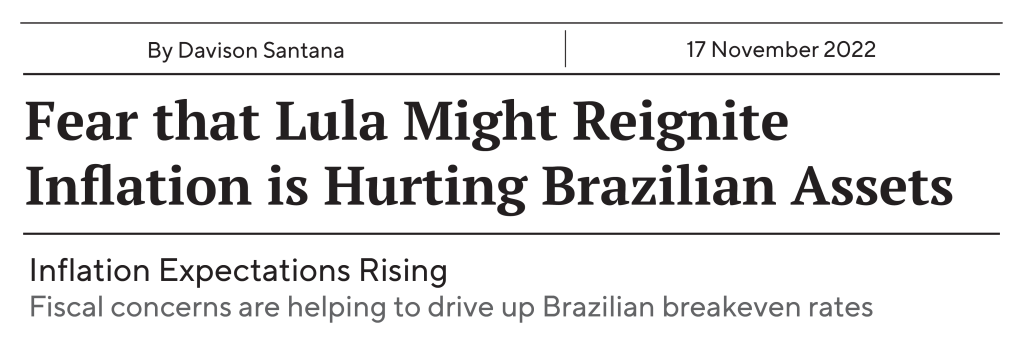
On a smaller scale, this was somewhat reminiscent of Q4 of 2022 when many investors looking at Brazil were worried about the so-called horrors of the newly elected Lula regime and what policies might negatively impact equity markets, as shown in the below headlines. Fortunately for us, we thought those fears were far too overblown and that worked out okay as well. We held a large position in a state—owned oil company in an emerging market when many investors were spooked by the headlines, also shown below. Again, in a politically tense environment where emotions often speak louder than logic, we stuck to our process and the facts.
More Negative Press
Contrast With Chinese Characteristics – Charts That Look Like the Matterhorn
However, contrast what we just highlighted with the likes of China, where, in our view, you need to be an expert mountain climber if you’re looking at the Matterhorn or an expert skier if you’re deciding on what diamond runs to tackle. From our perspective, many of the prior investment darlings in China resemble a giant incline of hope, as evidenced by the mountain-like characteristics in the photo below.
So, what gives? What’s driving the optimism? In our view, it’s a couple of things, and again, these are in stark contrast to a country like Indonesia or India, where we remain overweight, or even Brazil, where we’re also overweight. If we look at the below Chinese stock chart, as a small example, we continue to witness an unpredictable regulatory environment, this time across gaming, where in roughly three days, policy went from uber negative to somewhat less negative. But this isn’t new, as the non-stop recycled headlines of potential stimulus have given investors whiplash basically since the peak of the Matterhorn. This is also one of the primary drivers of our relatively persistent underweight China since the second half of 2021, where the regulatory whiplash, as shown in the example headlines, has clouded the earnings trajectory of a whole host of “new economy” names and has driven us into more “old economy” names for what little exposure we maintain. In the US, the mantra of “don’t fight the Fed” reigns somewhat supreme, while in China, it’s “don’t fight the CCP.” This hasn’t stopped investors from increasing their excitement for Chinese ETFs, which have grown at the “fastest pace on record,” according to a recent Reuters article.2
Expert Navigation Required

A Classic Chinese Stock Chart
Source: London Stock Exchange Group (LSEG). KWEB represents the KraneShares CSI China Internet ETF. Past performance may not be indicative of future results.
More Negative Press


Changing environments
It is human nature to rely on your past experiences and the knowledge you have acquired over the years to make decisions. While often useful, this can become a trap in investing, which is why constant reassessment of the landscape and adaptability to changing environments is key. In fact, this willingness to change our minds and adapt to new waters is one of the hallmarks of our process and philosophy. While certain managers face headwinds during inflection points, we tend to thrive on change. Hence, our history shows that we often do better in a more dynamic environment than during stable periods. This is a daily exercise. It takes humility to say that what you thought you knew and what worked for a long time no longer applies.
Developed markets technology is an area where we are more upbeat now, especially in semiconductors—the industry is still under-earning, and the frothiness of valuations is no longer there, in our opinion. Water fab equipment is still running at $85 billion, and memory companies are just turning profitable again. We believe this, combined with long-term structural growth drivers for semiconductors, makes this an attractive space. And this is in contrast with our pessimism in the second half of 2021 when we were very nervous about valuations in technology. The fascinating aspect is that most managers are still underweight technology, as detailed in the chart below. Talk about dogmatism!
Policy Whiplash Continues
Another area where our mindset has changed in 2023—for the time being—is alcohol. As we’ve discussed with the continued concerns around China, particularly from a growth perspective, whether at the top of the house or a variety of the underlying companies, is there an area that is likely to see a meaningful deceleration in earnings growth in the years ahead? In our minds, we think there is, and that area is alcohol.
Interestingly enough, the potential setbacks for alcohol, in general, are not unique to China as a whole host of companies in 2023, from LVMH to Rémy and, of course, AB InBev, discussed the challenges of the US market. We’re sure many of our readers know of the struggles of AB InBev throughout the calendar year, and while revenue declines for AB InBev certainly weighed on the category in general, we think there is something larger here at play (and no, in this case, it’s not the impact of GLP-1s). For beer specifically, it’s about changing preferences, with a recent article in The Wall Street Journal denoting a more than 5 per cent drop in annual shipments through the first nine months of 2023, by far the worst since the Global Financial Crisis. With two booms and busts in the last 10+ years (first craft beer, then hard seltzers), it’s been a difficult landscape for companies to navigate. Don’t take our word for it, as the President of the National Beer Wholesalers Association put it back in October: “this is an industry-wide, five-alarm fire.” 3
But again, this isn’t unique to beer, with Rémy Cointreau noting in its most recent earnings call from Q3 2023, that overall revenues plunged more than 20 per cent, with US sales falling nearly 50 per cent year over year! Talk about the diamond runs. Citing a range of unfavorable factors, combined with competition from other spirits such as tequila, which was cited as being an issue for beer as well, and you’ve got the mix of a highly unfavorable (snow) storm.4
Lastly, and this is another reason for our current pessimism on the space, could these entire industries go ex-growth given challenges to the premiumization thesis that has been a major growth driver for many years? We’re seeing a lot of fragmentation across the landscape from increased introduction of brands across verticals, and with increasing economic stress now even weighing on some more luxury names, will the trade-down trend reverse many years of high-end growth? We shall see if this continues, but again, from Rémy’s latest earnings call, the liqueurs and spirits division faced even more challenges than cognac, particularly at the high end, where they blamed the misfortunes of real estate millionaires that had typically underpinned that segment. So, time will tell.
Like all things, this view is certainly subject to change, for the one thing we can be sure of is that things constantly evolve, and our aim is to navigate those changes successfully, not stubbornly.
As always, thank you for your continued support.
Rajiv Jain
Chairman & Chief Investment Officer
GQG Partners LLC
| GQG Partners Composite Performance as of 12/31/2023 | 1 Year | 3 Years | 5 Years | Since Inception* |
| Emerging Markets Equity Composite (Net of fees) % | 30.87 | 0.57 | 10.82 | 6.39 |
| MSCI Emerging Markets Index (Net) % | 9.83 | -5.08 | 3.68 | 2.65 |
| Difference % | 21.04 | 5.65 | 7.14 | 3.74 |
| GQG Partners Global Equity Composite (Net of fees) % | 19.81 | 10.31 | 14.20 | 12.16 |
| MSCI ACWI Index (Net) % | 22.20 | 5.75 | 11.72 | 8.17 |
| Difference % | -2.39 | 4.56 | 2.48 | 3.99 |
| GQG Partners International Equity Composite (Net of fees) % | 22.47 | 6.99 | 12.73 | 9.71 |
| MSCI ACWI ex USA ND (Net) % | 15.62 | 1.55 | 7.08 | 4.25 |
| Difference % | 6.85 | 5.44 | 5.65 | 5.46 |
| GQG Partners US Equity Strategy Composite (Net of fees) % | 18.20 | 11.36 | 17.02 | 14.55 |
| S&P 500 % | 26.29 | 10.00 | 15.69 | 11.89 |
| Difference % | -8.09 | 1.36 | 1.33 | 2.66 |
GQG Partners LLC claims compliance with the Global Investment Performance Standards (GIPS®) and has prepared and presented this performance information in compliance with the GIPS standards. GIPS® is a registered trademark of CFA Institute. CFA Institute does not endorse or promote this organization, nor does it warrant the accuracy or quality of the content contained herein. GIPS composite reports may be obtained by emailing clientservices@gqgpartners.com.
Performance data is based on the firm’s composites for each strategy. The composites were created in June 2016. Performance presented prior to June 1, 2016 was achieved prior to the creation of the firm. The prior track record has been reviewed by Ashland Partners & Company, LLP and conforms to the portability requirements of the GIPS standards. On June 28, 2017, ACA Performance Services, LLC acquired the investment performance service business of Ashland Partners & Company, LLP. For periods after June 1, 2016, the composites consist of accounts managed by GQG pursuant to the strategy.
The US dollar is the currency used to express performance. Returns are presented net of management fees and include the reinvestment of all income. Net performance is calculated after the deduction of actual trading expenses and other administrative fees (custody, legal, administration, audit and organization fees). Net returns are calculated using the highest/model rack rate fee. Net performance is net of foreign withholding taxes. PAST PERFORMANCE MAY NOT BE INDICATIVE OF FUTURE RESULTS. Please see the Appendix for additional disclosures regarding the composites. Returns for periods greater than one year are annualized.
* The US Equity composite inception performance data is since July 1, 2014. The GQG Partners Global Equity inception performance data is since October 1, 2014. The GQG Partners International Equity and Emerging Markets Equity inception performance data is since December 1, 2014.
DEFINITIONS
Wafer Fab Equipment (WFE) Market: Market comprising the manufacturers of the machines which in turn manufacture semiconductors.
END NOTES
1Mises, Ludwig von. Human Action, Scholar’s Edition. 2008.
2China sees an ETF boom as investors wait for stocks to trough
3The Bud Light Boycott Was Just the Beginning of a Crazy Year for Beer
4Half Year 2024 Remy Cointreau SA Earnings Call, November 30, 2023
IMPORTANT INFORMATION
The information provided in this document does not constitute investment advice and no investment decision should be made based on it. Neither the information contained in this document or in any accompanying oral presentation is a recommendation to follow any strategy or allocation. In addition, neither is a recommendation, offer or solicitation to sell or buy any security or to purchase of shares in any fund or establish any separately managed account. It should not be assumed that any investments made by GQG Partners LLC (GQG) in the future will be profitable or will equal the performance of any securities discussed herein. Before making any investment decision, you should seek expert, professional advice, including tax advice, and obtain information regarding the legal, fiscal, regulatory and foreign currency requirements for any investment according to the law of your home country, place of residence or current abode.
This document reflects the views of GQG as of a particular time. GQG’s views may change without notice. Any forward-looking statements or forecasts are based on assumptions and actual results may vary. GQG provides this information for informational purposes only. GQG has gathered the information in good faith from sources it believes to be reliable, including its own resources and third parties. However, GQG does not represent or warrant that any information, including, without limitation, any past performance results and any third-party information provided, is accurate, reliable or complete, and it should not be relied upon as such. GQG has not independently verified any information used or presented that is derived from third parties, which is subject to change. Information on holdings, allocations, and other characteristics is for illustrative purposes only and may not be representative of current or future investments or allocations.
Past performance may not be indicative of future results. Performance may vary substantially from year to year or even from month to month. The value of investments can go down as well as up. Future performance may be lower or higher than the performance presented and may include the possibility of loss of principal. It should not be assumed that investments made in the future will be profitable or will equal the performance of securities listed herein.
The information contained in this document is unaudited. It is published for the assistance of recipients, but is not to be relied upon as authoritative and is not to be substituted for the exercise of one’s own judgment. GQG is not required to update the information contained in these materials, unless otherwise required by applicable law. No portion of this document and/or its attachments may be reproduced, quoted or distributed without the prior written consent of GQG.
GQG is registered as an investment adviser with the U.S. Securities and Exchange Commission. Please see GQG’s Form ADV Part 2, which is available upon request, for more information about GQG.
Any account or fund advised by GQG involves significant risks and is appropriate only for those persons who can bear the economic risk of the complete loss of their investment. There is no assurance that any account or fund will achieve its investment objectives. Accounts and funds are subject to price volatility and the value of a portfolio will change as the prices of investments go up or down. Before investing in a strategy, you should consider the risks of the strategy as well as whether the strategy is appropriate based upon your investment objectives and risk tolerance.
There may be additional risks associated with international and emerging markets investing involving foreign, economic, political, monetary, and/or legal factors. International investing is not for everyone. You can lose money by investing in securities.
Where referenced, the title Partner for an employee of GQG Partners LLC indicates the individual’s leadership status within the organization. While Partners hold equity interests in GQG Partners Inc., as a legal matter they do not hold partnership interests in GQG Partners LLC or GQG Partners Inc.
GQG Partners LLC is a wholly owned subsidiary of GQG Partners Inc., a Delaware corporation that is listed on the Australian Securities Exchange.
INFORMATION ON BENCHMARKS
The MSCI USA Growth Index captures large and mid cap securities exhibiting overall growth style characteristics in the US. The growth investment style characteristics for index construction are defined using five variables: long-term forward EPS growth rate, short-term forward EPS growth rate, current internal growth rate and long-term historical EPS growth trend and long-term historical sales per share growth trend.
The MSCI USA Index is designed to measure the performance of the large and mid cap segments of the US market. With 609 constituents, the index covers approximately 85% of the free float-adjusted market capitalization in the US.
The MSCI China Index captures large and mid cap representation across China A shares, H shares, B shares, Red chips, P chips and foreign listings (e.g. ADRs). With 717 constituents, the index covers about 85% of this China equity universe. Currently, the index includes Large Cap A and Mid Cap A shares represented at 20% of their free float adjusted market capitalization.
The MSCI All Country World Index (MSCI ACWI) captures large and mid cap representation across 23 Developed Markets (DM) and 24 Emerging Markets (EM) countries. With 2,921 constituents, the index covers approximately 85% of the global investable equity opportunity set. DM countries include: Australia, Austria, Belgium, Canada, Denmark, Finland, France, Germany, Hong Kong, Ireland, Israel, Italy, Japan, Netherlands, New Zealand, Norway, Portugal, Singapore, Spain, Sweden, Switzerland, the UK and the US. EM countries include: Brazil, Chile, China, Colombia, Czech Republic, Egypt, Greece, Hungary, India, Indonesia, Korea, Kuwait, Malaysia, Mexico, Peru, Philippines, Poland, Qatar, Saudi Arabia, South Africa, Taiwan, Thailand, Turkey and United Arab Emirates.
The MSCI All Country World ex USA Index (MSCI ACWI ex USA) captures large and mid cap representation across 22 of 23 Developed Markets (DM) countries (excluding the US) and 24 Emerging Markets (EM) countries. With 2,312 constituents, the index covers approximately 85% of the global equity opportunity set outside the US. DM countries include: Australia, Austria, Belgium, Canada, Denmark, Finland, France, Germany, Hong Kong, Ireland, Israel, Italy, Japan, Netherlands, New Zealand, Norway, Portugal, Singapore, Spain, Sweden, Switzerland and the UK. EM countries include: Brazil, Chile, China, Colombia, Czech Republic, Egypt, Greece, Hungary, India, Indonesia, Korea, Kuwait, Malaysia, Mexico, Peru, Philippines, Poland, Qatar, Saudi Arabia, South Africa, Taiwan, Thailand, Turkey and United Arab Emirates.
The MSCI Emerging Markets Index captures large and mid cap representation across 24 Emerging Markets (EM) countries. With 1,441 constituents, the index covers approximately 85% of the free float-adjusted market capitalization in each country. EM countries include: Brazil, Chile, China, Colombia, Czech Republic, Egypt, Greece, Hungary, India, Indonesia, Korea, Kuwait, Malaysia, Mexico, Peru, Philippines, Poland, Qatar, Saudi Arabia, South Africa, Taiwan, Thailand, Turkey and United Arab Emirates.
The S&P 500® Index is a widely used stock market index that can serve as barometer of US stock market performance, particularly with respect to larger capitalization stocks. It is a market-weighted index of stocks of 500 leading companies in leading industries and represents a significant portion of the market value of all stocks publicly traded in the United States.
NOTICE TO AUSTRALIA & NEW ZEALAND INVESTORS
The information in this document is issued and approved by GQG Partners LLC (“GQG”), a limited liability company and authorised representative of GQG Partners (Australia) Pty Ltd, ACN 626 132 572, AFSL number 515673. This information and our services may only be provided to retail and wholesale clients (as defined in section 761G of the Corporations Act 2001 (Cth)) domiciled in Australia. This document contains general information only, does not contain any personal advice and does not take into account any prospective investor’s objectives, financial situation or needs. In New Zealand, any offer of a Fund is limited to ‘wholesale and retail investors’ within the meaning of clause 3(2) of Schedule 1 of the Financial Markets Conduct Act 2013. This information is not intended to be distributed or passed on, directly or indirectly, to any other class of persons in Australia and New Zealand, or to persons outside of Australia and New Zealand.
NOTICE TO CANADIAN INVESTORS
This document has been prepared solely for information purposes and is not an offering memorandum nor any other kind of an offer to buy or sell or a solicitation of an offer to buy or sell any security, instrument or investment product or to participate in any particular trading strategy. It is not intended and should not be taken as any form of advertising, recommendation or investment advice. This information is confidential and for the use of the intended recipients only. The distribution of this document in Canada is restricted to recipients in certain Canadian jurisdictions who are eligible “permitted clients” for purposes of National Instrument 31-103 Registration Requirements, Exemptions and Ongoing Registrant Obligations.
NOTICE TO SOUTH AFRICAN INVESTORS
Investors should take cognisance of the fact that there are risks involved in buying or selling any financial product. Past performance of a financial product is not necessarily indicative of future performance. The value of financial products can increase as well as decrease over time, depending on the value of the underlying securities and market conditions. The investment value of a financial product is not guaranteed and any Illustrations, forecasts or hypothetical data are not guaranteed, these are provided for illustrative purposes only. This document does not constitute a solicitation, invitation or investment recommendation. Prior to selecting a financial product or fund it is recommended that South Africa based investors seek specialised financial, legal and tax advice. GQG PARTNERS LLC is a licenced financial services provider with the Financial Sector Conduct Authority (FSCA) of the Republic of South Africa, with FSP number 48881.
NOTICE TO UNITED KINGDOM INVESTORS
GQG Partners LLC is not an authorised person for the purposes of the Financial Services and Markets Act 2000 of the United Kingdom (“FSMA”) and the distribution of this document in the United Kingdom is restricted by law. Accordingly, this document is provided only for and is directed only at persons in the United Kingdom reasonably believed to be of a kind to whom such promotions may be communicated by a person who is not an authorised person under FSMA pursuant to the FSMA (Financial Promotion) Order 2005 (the “FPO”). Such persons include: (a) persons having professional experience in matters relating to investments; and (b) high net worth bodies corporate, partnerships, unincorporated associations, trusts, etc. falling within Article 49 of the FPO. The services provided by GQG Partners LLC and the investment opportunities described in this document are available only to such persons, and persons of any other description may not rely on the information in it. All, or most, of the rules made under the FSMA for the protection of retail clients will not apply, and compensation under the United Kingdom Financial Services Compensation Scheme will not be available.
GQG Partners LLC (UK) Ltd. is a company registered in England and Wales, registered number 1175684. GQG Partners LLC (UK) Ltd. is an appointed representative of Sapia Partners LLP, which is a firm authorised and regulated by the Financial Conduct Authority (“FCA”) (550103).
© 2024 GQG Partners LLC. All rights reserved. Data presented as at 31 December 2023 and denominated in US dollars (US$) unless otherwise indicated.
CIOLTR4Q23